
Chart Patterns
47Neutral
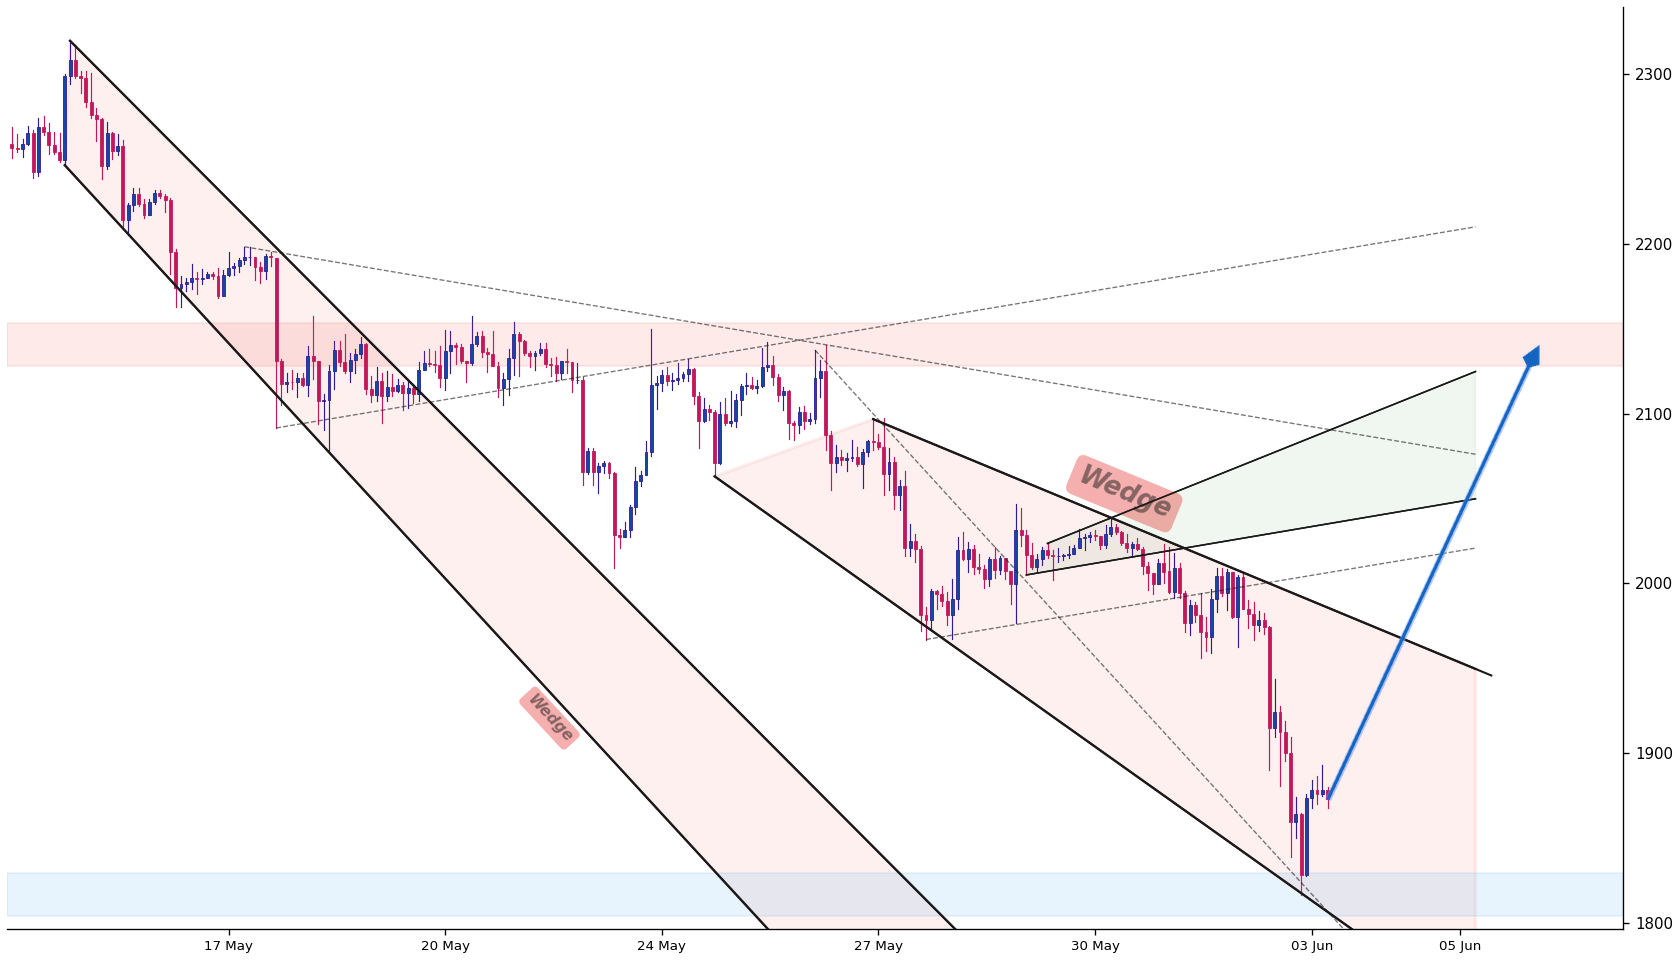
AI-detected pattern quality, breakout zones, trend structure, support, and resistance.
Live Ethereum analysis. Check AI-detected chart patterns, automated technical indicators (RSI, MACD), and track verified professional traders trading Ethereum in real-time.
AI-detected pattern quality, breakout zones, trend structure, support, and resistance.
TraderStat checks Ethereum for active chart structures, support and resistance behavior, breakout probability, and invalidation zones.
Verified trader positioning and signal quality for this instrument.
Blockchain activity, exchange flows, whale behavior, and liquidity movement.
15 automated indicators including RSI, MACD, moving averages, volatility, trend strength, and volume confirmation.
AI-detected pattern quality, breakout zones, trend structure, support, and resistance.
Market structure, liquidity, risk filters, social positioning, and asset-specific context.
Exchange flow, whale movement, active addresses, liquidity shifts, and blockchain activity are normalized into an on-chain score for Ethereum.
15 core technical indicators are stored in Supabase metrics_json and rendered server-side for Ethereum, covering trend, momentum, volatility, volume, and price-location analysis.
| Metric | Score | Signal | What it means |
|---|---|---|---|
| RSI | 81/100 | Strong Buy | Relative Strength Index for overbought, oversold, and momentum pressure. |
| MACD | 64/100 | Buy | Trend and momentum confirmation from moving average convergence/divergence. |
| Moving Averages | 63/100 | Buy | Price position versus key simple moving averages. |
| EMA Trend | 51/100 | Neutral | Exponential moving average alignment across short and medium periods. |
| Bollinger Bands | 85/100 | Strong Buy | Volatility band position, expansion, and squeeze behavior. |
| Stochastic Oscillator | 57/100 | Neutral | Momentum rotation between overbought and oversold zones. |
| ADX | 49/100 | Neutral | Trend strength without regard to bullish or bearish direction. |
| ATR Volatility | 72/100 | Buy | Average true range and volatility expansion risk. |
| OBV | 60/100 | Buy | On-balance volume confirmation of buying or selling pressure. |
| Volume Trend | 70/100 | Buy | Volume participation behind the current price move. |
| Momentum | 89/100 | Strong Buy | Rate of change and directional impulse quality. |
| CCI | 94/100 | Strong Buy | Commodity Channel Index for trend deviation and reversal pressure. |
| Williams %R | 96/100 | Strong Buy | Short-term exhaustion and reversal risk in the current swing. |
| VWAP | 94/100 | Strong Buy | Price quality versus volume-weighted average price. |
| Ichimoku Cloud | 74/100 | Buy | Cloud, conversion line, base line, and trend context alignment. |
| Technical Score | 73/100 | Buy | Combined automated technical analysis score. |
| Chart Patterns | 47/100 | Neutral | Detected pattern quality and trend structure. |
| On-Chain Metrics | 90/100 | Strong Buy | Crypto-only blockchain and liquidity layer. |
| Fundamental Score | 89/100 | Strong Buy | Combined fundamental context from liquidity, risk, social positioning, and market-specific data. |
TraderStat links this instrument to trader profiles by counting how often it appears in verified signal history.
No verified trader history for this instrument yet.
No other crypto instruments currently meet the Strong Buy threshold.
Log in to your TraderStat profile.