Understanding AI Signal Accuracy: How to Evaluate Crypto Signal Providers with Statistics
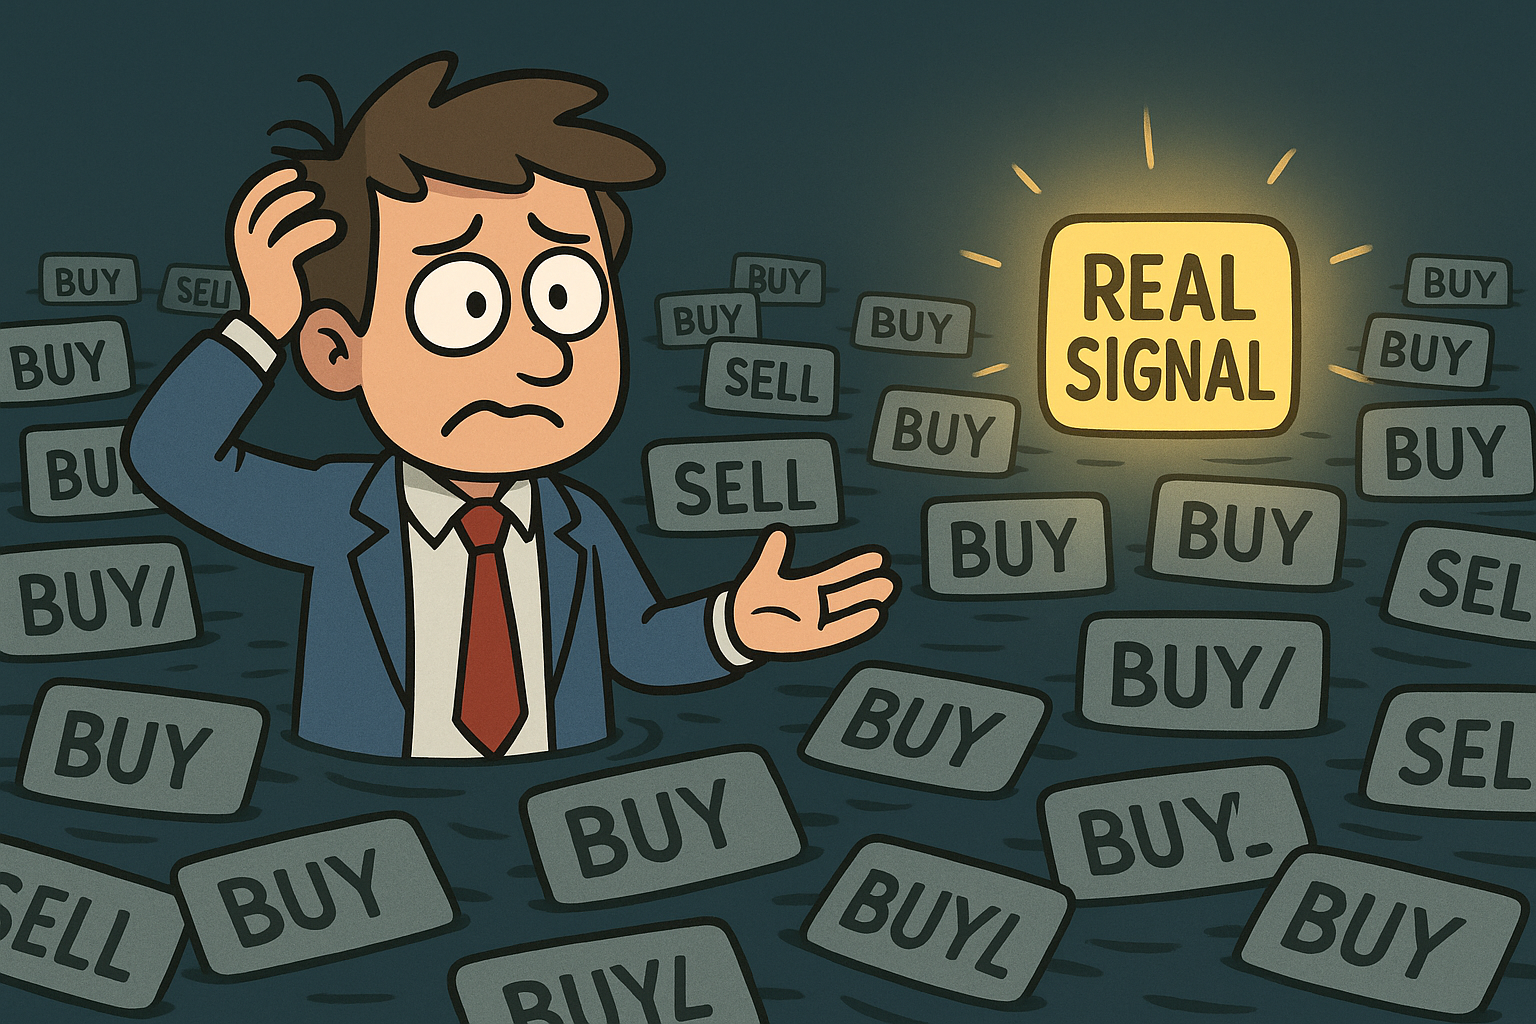
In a market flooded with AI signal providers, how do you separate the signal from the noise? As artificial intelligence continues to revolutionize the world of cryptocurrency trading, thousands of traders are turning to AI-powered crypto signal providers to gain a competitive edge. These providers offer promises of high-accuracy buy, sell, and hold recommendations, often based on machine learning models crunching vast amounts of market data.
But with opportunity comes risk. Not all signal providers are created equal, and in a space known for volatility and hype, traders need more than just bold claims. They need evidence. That’s where statistical evaluation comes in. This guide will walk you through the critical statistical methods and metrics that can help you assess whether an AI signal provider is trustworthy, transparent, and truly valuable to your trading strategy.
What Are AI Crypto Signals?
AI crypto signals are automated trade recommendations generated by artificial intelligence systems. These signals typically include suggested entry and exit points, direction (buy/sell), and sometimes risk levels or stop-loss parameters. Unlike human-generated signals, AI-based signals are created by algorithms trained on historical and real-time data.
These systems analyze various types of input: price trends, trading volumes, technical indicators, and even social media sentiment. Some use deep learning models, like recurrent neural networks (RNNs), to detect complex patterns in time-series data, while others employ natural language processing (NLP) to interpret news events or tweets.
The appeal is clear: AI reduces emotional bias, processes more data than any human can, and reacts in real-time to market shifts. However, no system is perfect. Risks include overfitting to historical data, poor generalization to new market conditions, and misleading claims based on selective reporting.
Why Statistical Evaluation Matters
Many traders fall into the trap of trusting flashy marketing, anecdotal testimonials, or simplistic win-rate metrics. But such surface-level indicators can be dangerously misleading. A signal provider boasting an 80% accuracy rate might still be losing money if the profitable trades are small and the losing trades are large.
Statistical evaluation provides a data-driven, objective framework to assess true signal performance. By analyzing key metrics, traders can uncover deeper insights into a system's reliability, consistency, and risk profile.
Consider the consequences of blind trust: poor performance, unnecessary losses, and missed opportunities. On the flip side, using statistics allows you to identify providers who offer stable, risk-adjusted returns over time, even in volatile market conditions. Transparency and measurable results should be the baseline standard for any provider in this space.
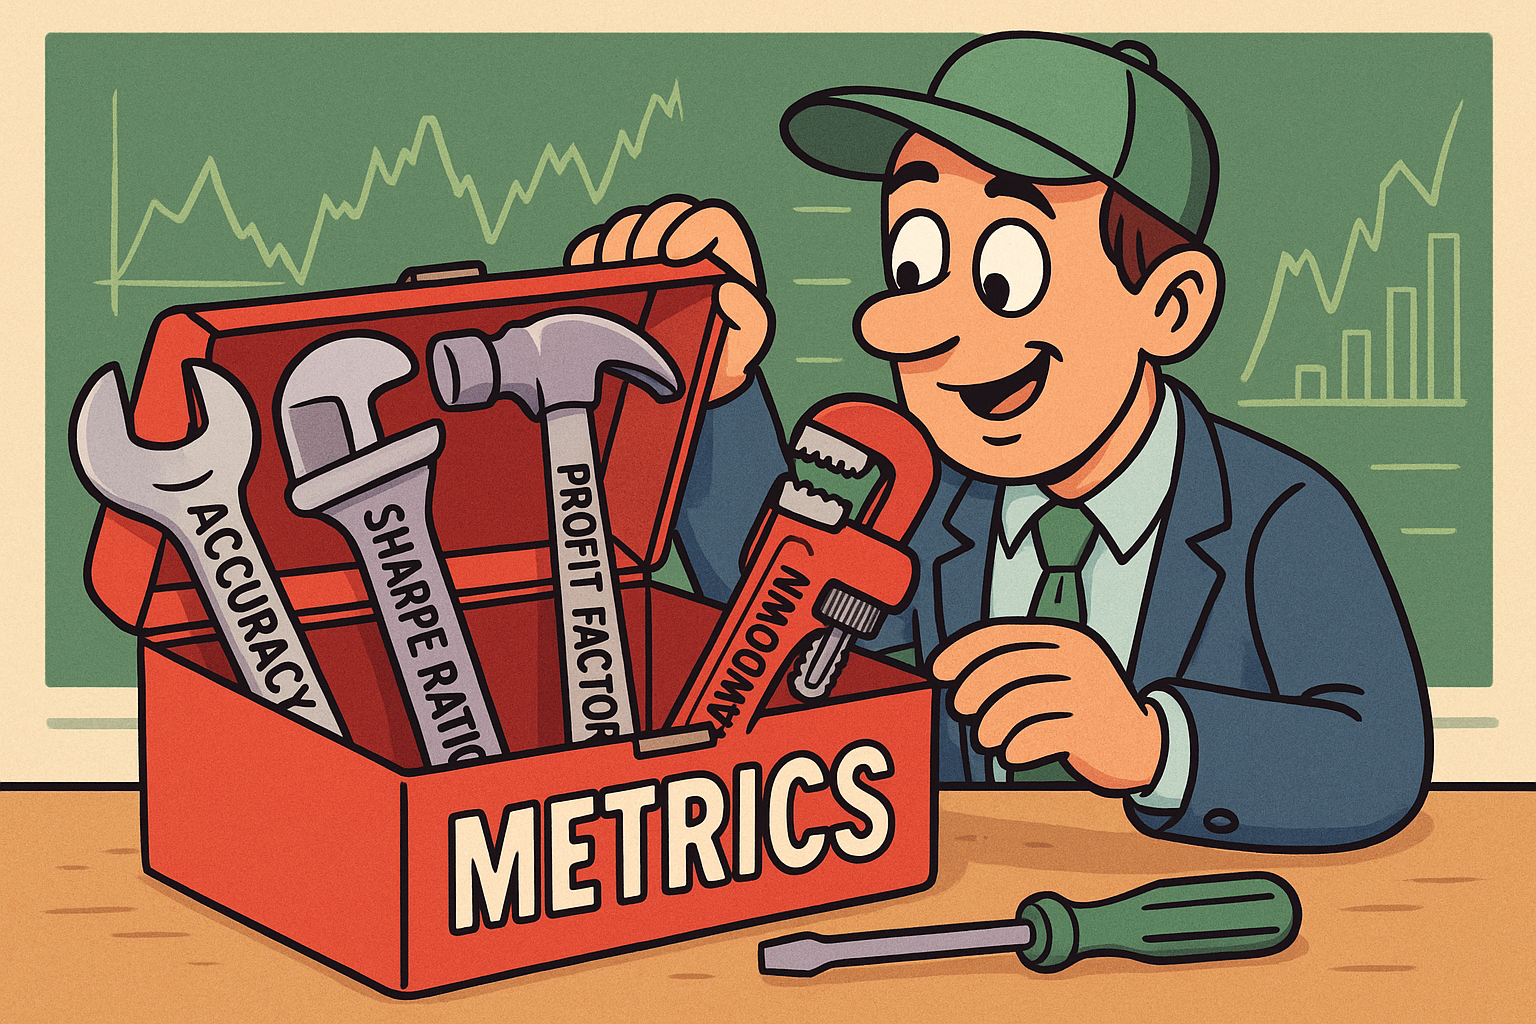
Key Statistical Metrics for Evaluating AI Signals
Understanding and applying the right metrics is crucial for evaluating the reliability of AI signal providers. Here are the most important ones:
- Accuracy Rate
- Definition: Percentage of correct predictions (e.g., price moved in predicted direction).
- Limitations: Doesn’t account for the size of gains or losses. A provider might be accurate but unprofitable if wins are small and losses are large.
- Formula: (Correct Signals / Total Signals) x 100
- Precision, Recall, and F1 Score
- Precision: Of all signals predicting a profitable trade, how many were actually profitable?
- Formula: True Positives / (True Positives + False Positives)
- Recall: Of all actual profitable opportunities, how many did the system capture?
- Formula: True Positives / (True Positives + False Negatives)
- F1 Score: Harmonic mean of precision and recall, balancing both.
- Formula: 2 x (Precision x Recall) / (Precision + Recall)

- Profit Factor
- Definition: Ratio of gross profit to gross loss.
- Formula: Total Profits / Total Losses
- Interpretation: A profit factor >1 means profitability; >1.5 is good; >2 is excellent.
- Sharpe Ratio
- Definition: Measures return relative to risk (volatility).
- Formula: (Average Return – Risk-Free Rate) / Standard Deviation of Return
- Use: Higher Sharpe ratios indicate better risk-adjusted performance.
- Maximum Drawdown
- Definition: The largest peak-to-trough loss over a period.
- Use: Helps evaluate risk exposure. Lower drawdowns are preferred.
- Win/Loss Ratio
- Definition: Number of winning trades vs. losing trades.
- Caveat: Must be considered with average win/loss size.
Example:
Imagine a provider with:
- 65% accuracy
- 2.2 profit factor
- 0.85 Sharpe ratio
- Max drawdown of 12%
- Win/Loss ratio of 1.5
This setup suggests a generally profitable and well-managed strategy, though it should still be tested under different market conditions.
How to Collect and Analyze Signal Data
To apply these metrics, you need access to transparent, verifiable data.
- Request Historical Performance
Ask the provider for full trade logs including:
- Entry/Exit prices and timestamps
- Trade direction and duration
- Win/loss outcome
- Check Sample Size
For statistical relevance, at least 100 trades are recommended. Smaller samples may yield misleading conclusions due to variance.
- Use Analysis Tools
- Excel/Google Sheets: For basic metrics.
- Python (Pandas, NumPy, Matplotlib): For deeper analysis.
- Backtesting Platforms: QuantConnect, TradingView scripts, or MetaTrader strategies.
- Spot Red Flags
- Lack of data transparency
- Cherry-picked trades
- Overly consistent performance (could indicate curve-fitting)
- No real-time results available
- Compare Backtested vs. Live Performance
Backtests can be misleading due to hindsight bias. Confirm that performance holds in forward-testing or live trading.
Practical Steps to Evaluate a Signal Provider
Here is a step-by-step process to help you make a confident, informed decision:
Step 1: Request Full Performance Reports
- Ask for trade-by-trade outcomes over time.
- Look for independent third-party verification, if possible.
Step 2: Calculate Key Metrics
- Use accuracy, precision, profit factor, Sharpe ratio, and drawdown.
- Focus on metrics that align with your risk tolerance and strategy.
Step 3: Test Across Market Conditions
- Bull, bear, and sideways periods.
- Signals should show adaptability.
Step 4: Assess Transparency
- Does the provider disclose their methodology?
- Are signals reproducible and timestamped?
Step 5: Use a Demo Account First
- Never trade real capital on untested signals.
- Simulate trades for a few weeks to validate live performance.
Checklist:
- Provider shares full trade logs
- Sample size > 100 trades
- Metrics like profit factor > 1.5 and Sharpe ratio > 0.5
- Demonstrates performance across various markets
- Signals tested in demo account
Common Pitfalls and How to Avoid Them
- Overreliance on Accuracy
A high accuracy rate without context can hide poor risk management or small profits offset by large losses.
- Cherry-Picked Results
Some providers only show their best trades. Always demand full performance transparency.
- Overfitted Models
AI systems trained too tightly to historical data may fail in live markets. Look for evidence of forward testing.
- Unrealistic Claims
Beware of anyone guaranteeing results like "90% win rate" or "no losses." Legitimate providers are honest about risks.

Conclusion
In the high-stakes world of crypto trading, informed decisions are your greatest asset. By applying rigorous statistical evaluation to AI signal providers, you move beyond hype and into reality. Metrics like accuracy, profit factor, Sharpe ratio, and drawdown tell a more complete story than flashy win rates or testimonials ever could. Start evaluating your signal providers with these tools, and you’ll be trading smarter, not harder. For more resources, insights, and reviews of AI trading systems. Explore our database of statistically verified signal providers.