Ideas
Want to trade with the best? Start winning your trades.
-
 Check free traders' forecasts
 -
 Check profit per trade
 -
 Analyze general statistics
 -
 Publish traders' forecasts here
- We not only publish only good traders, but we do NOT publish forecasts for instruments they poorly analyze.
- 94% accuracy of our program for testing forecasts.
- We only publish traders, who have checked more than 85% of deals.
- Many traders make their forecasts without SL. That's why we use standard TP:SL ratio 2:1.
- Not all predictions can be checked because some forecasts are hard to write (some TP, unclear entry point etc.).
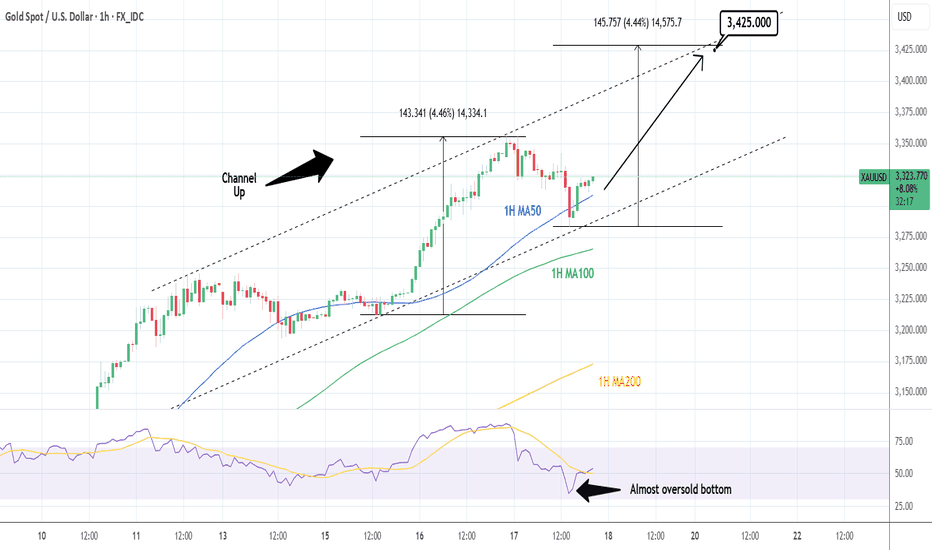
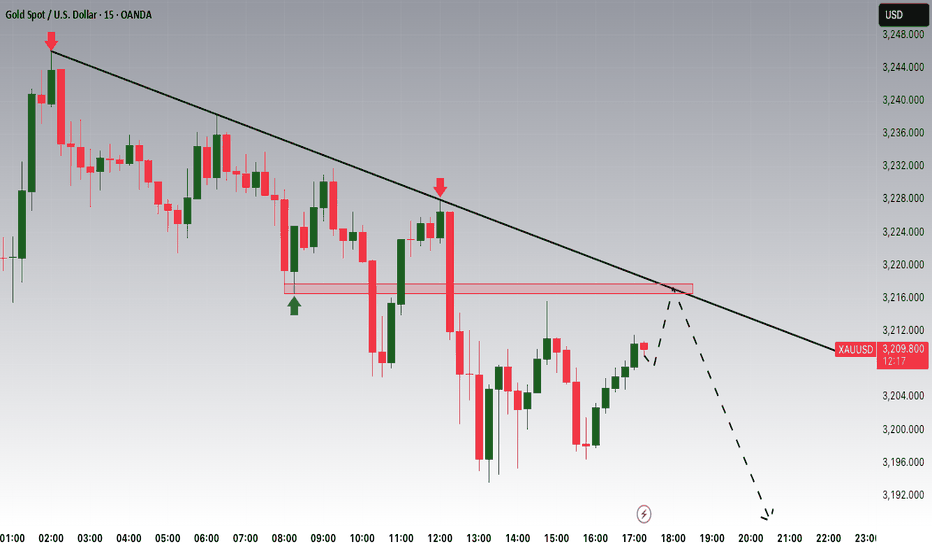
XAUUSD, 60
Short-Term
17 April 2025

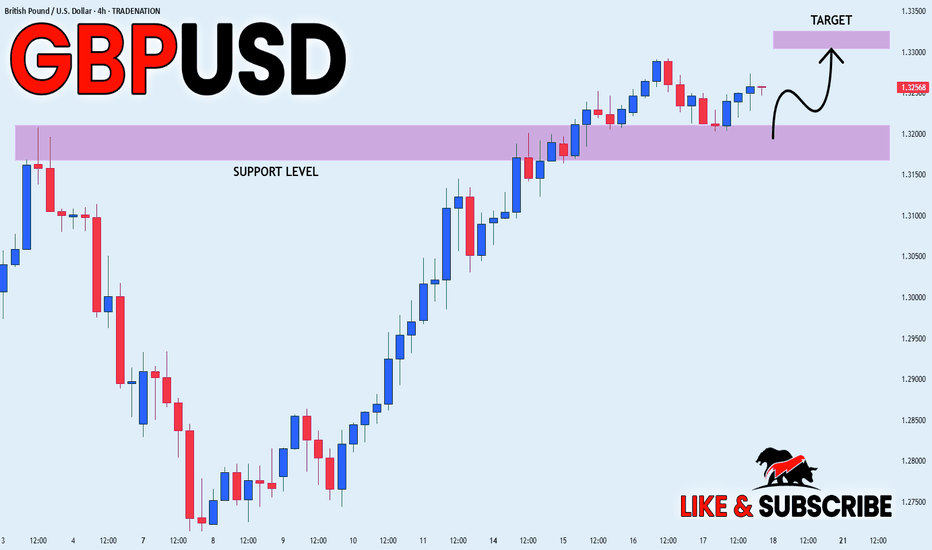
GBPUSD, 240
Long-Term
17 April 2025

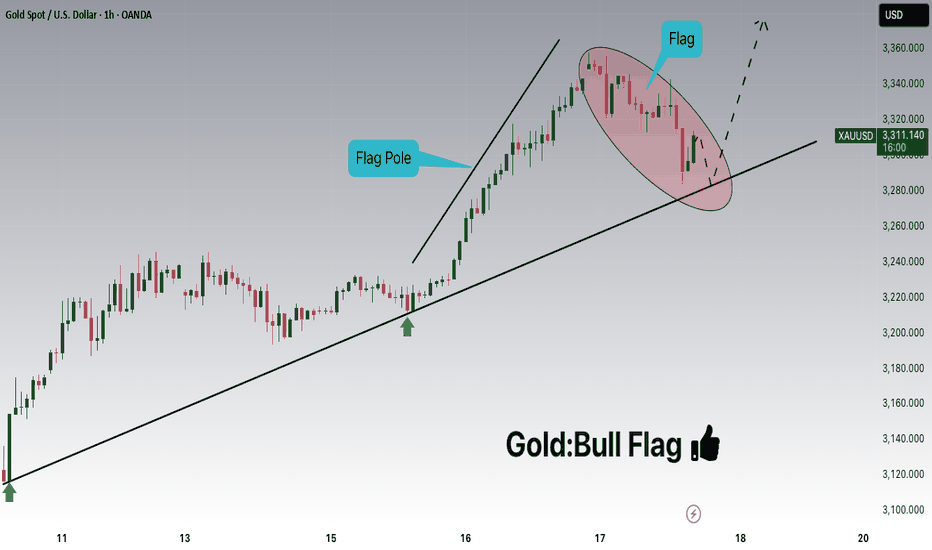
XAUUSD, 60
Short-Term
17 April 2025

XAUUSD, 480
Long-Term
17 April 2025

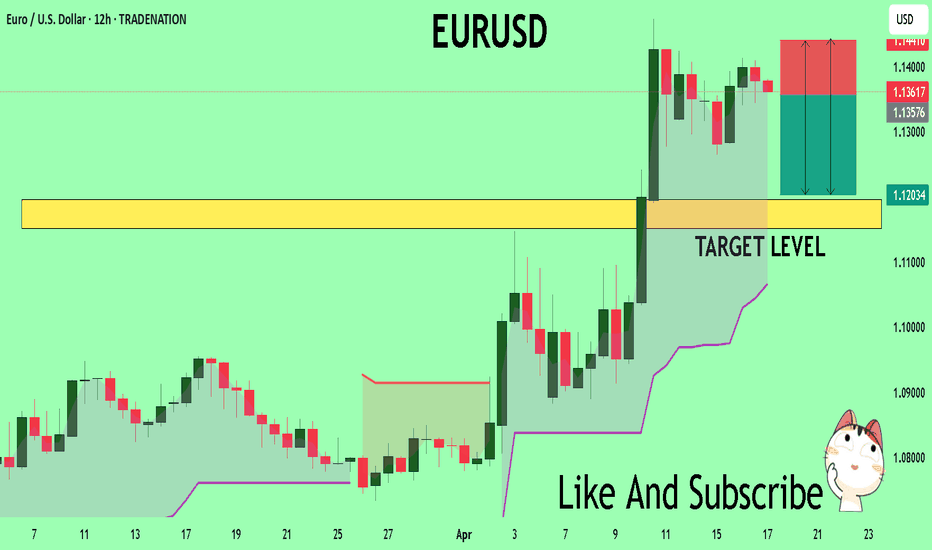
EURUSD, 720
Long-Term
17 April 2025

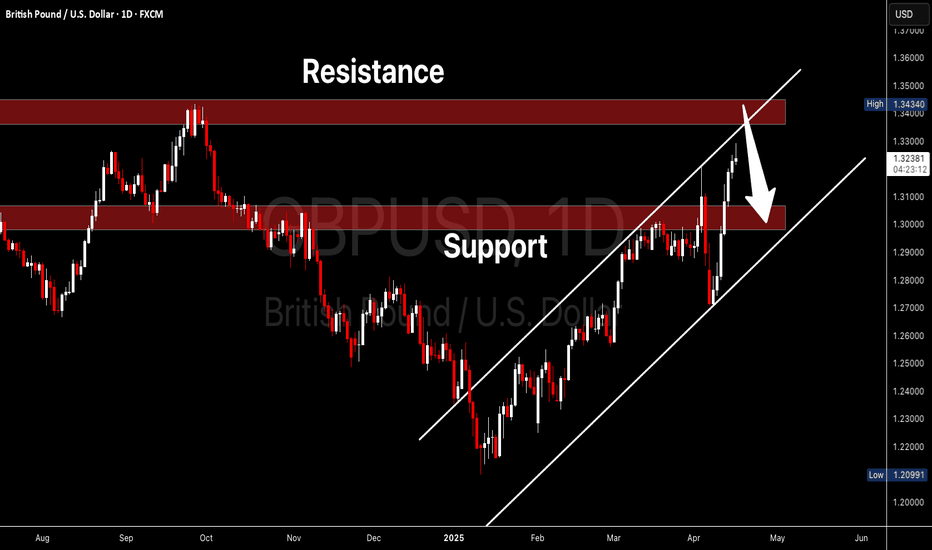
GBPUSD, 1D
Long-Term
16 April 2025

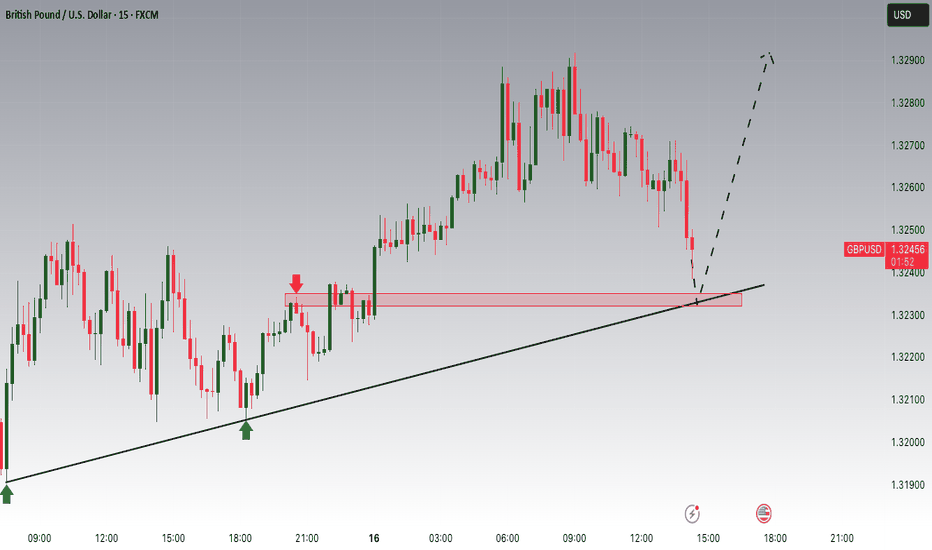
GBPUSD, 15
Short-Term
16 April 2025
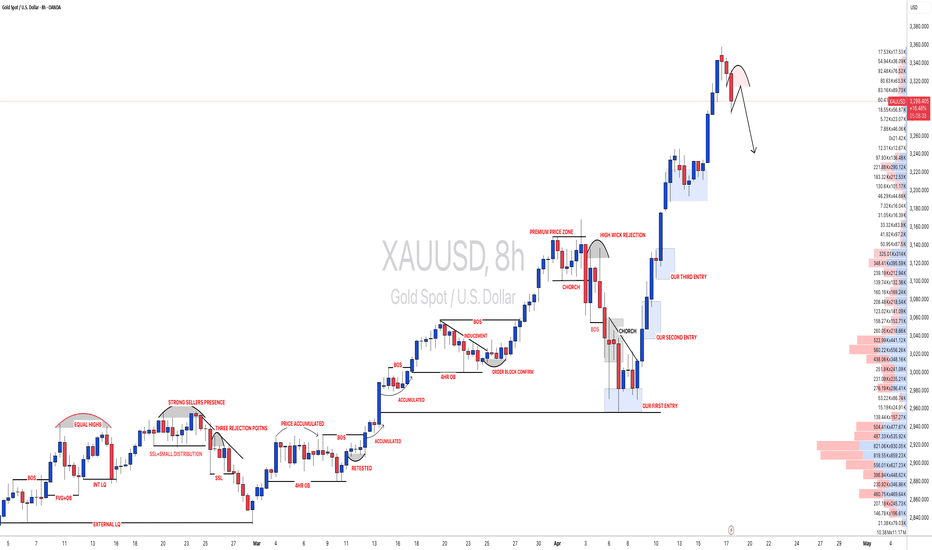
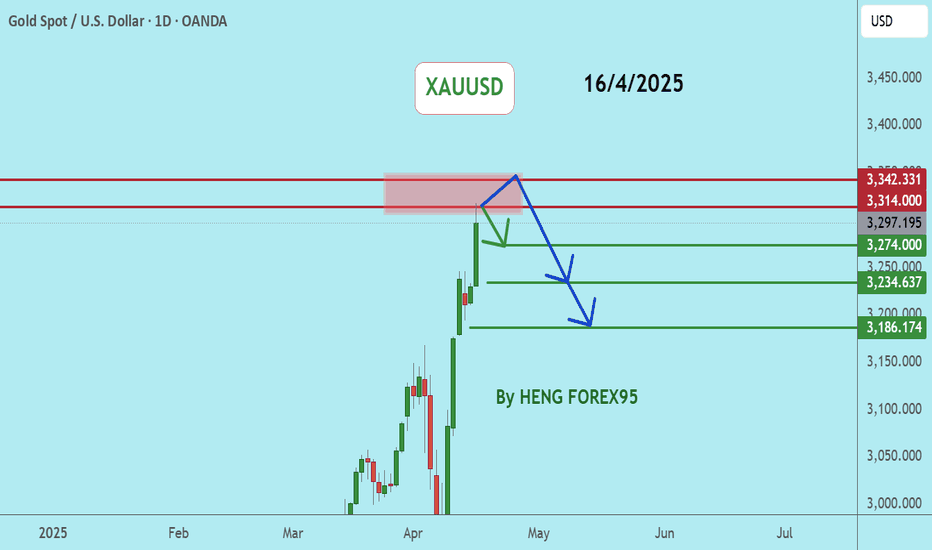
XAUUSD, 1D
Long-Term
16 April 2025
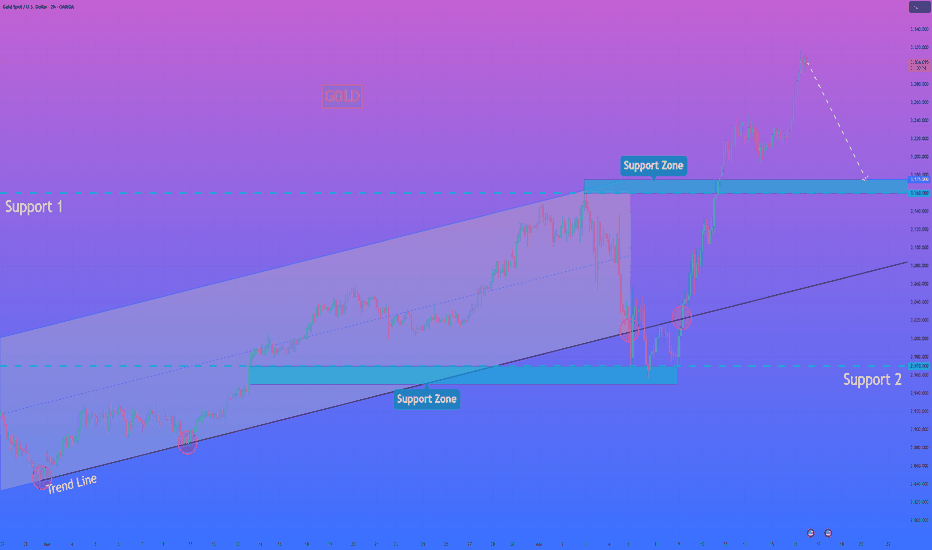
XAUUSD, 120
Medium-Term
16 April 2025
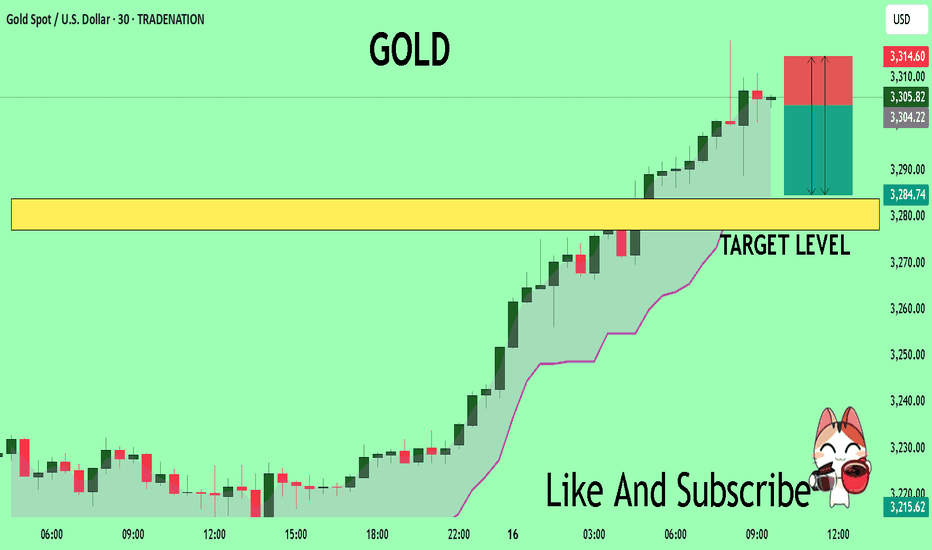
XAUUSD, 30
Short-Term
16 April 2025
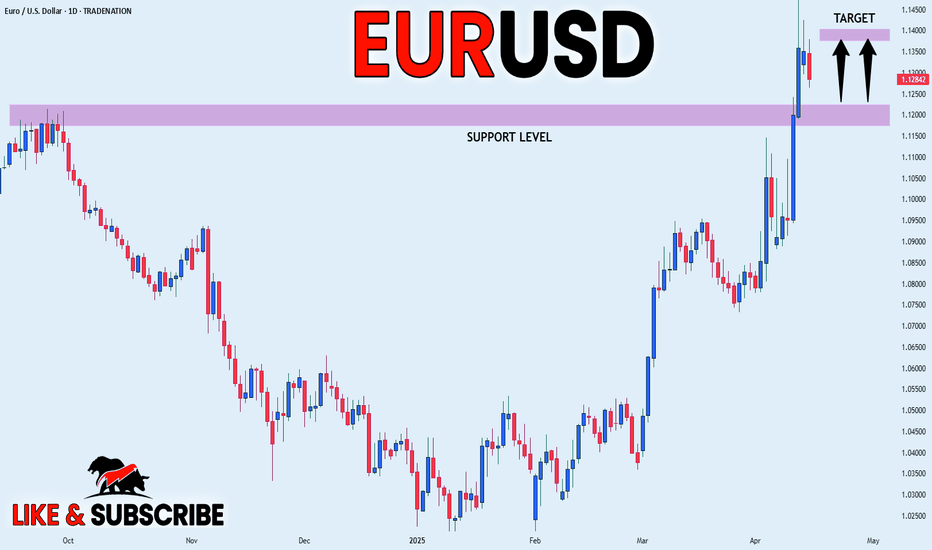
EURUSD, 1D
Long-Term
15 April 2025
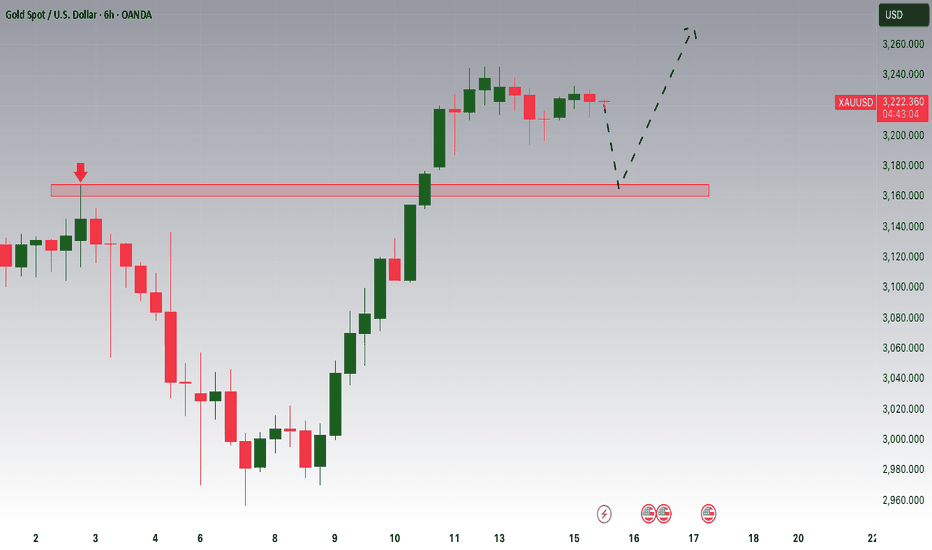
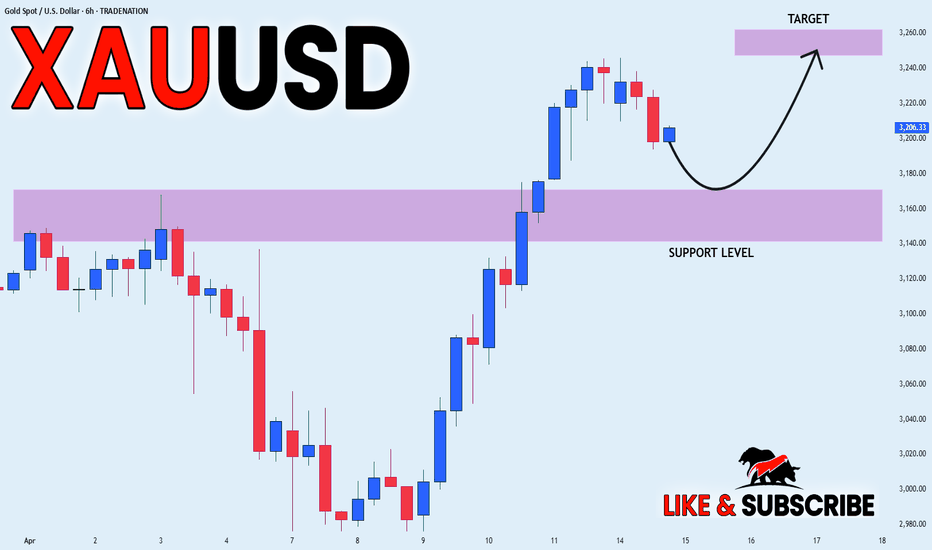
XAUUSD, 360
Long-Term
15 April 2025
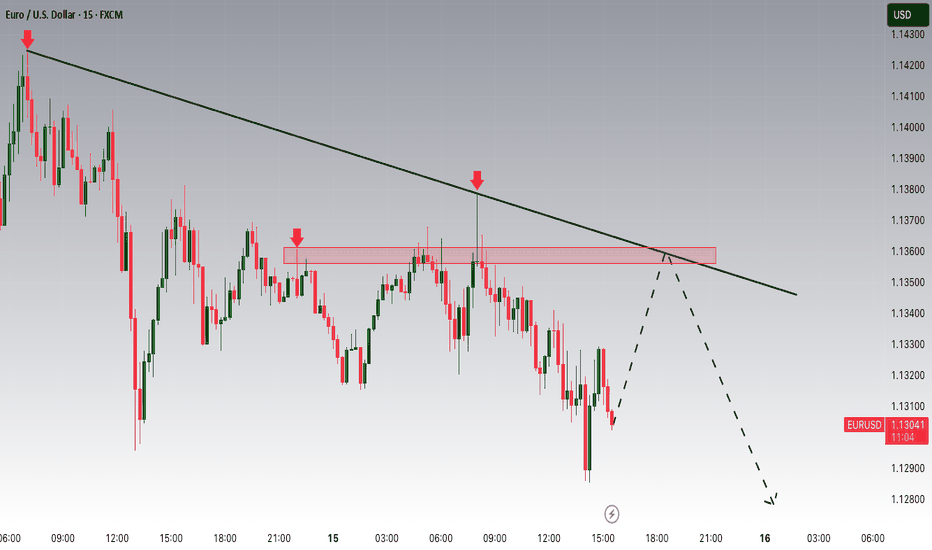
EURUSD, 15
Short-Term
15 April 2025
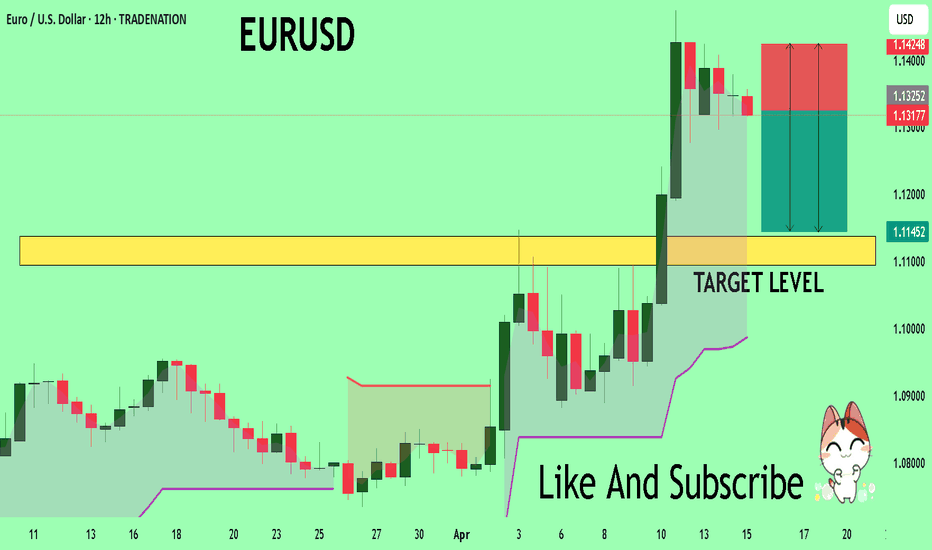
EURUSD, 720
Long-Term
15 April 2025
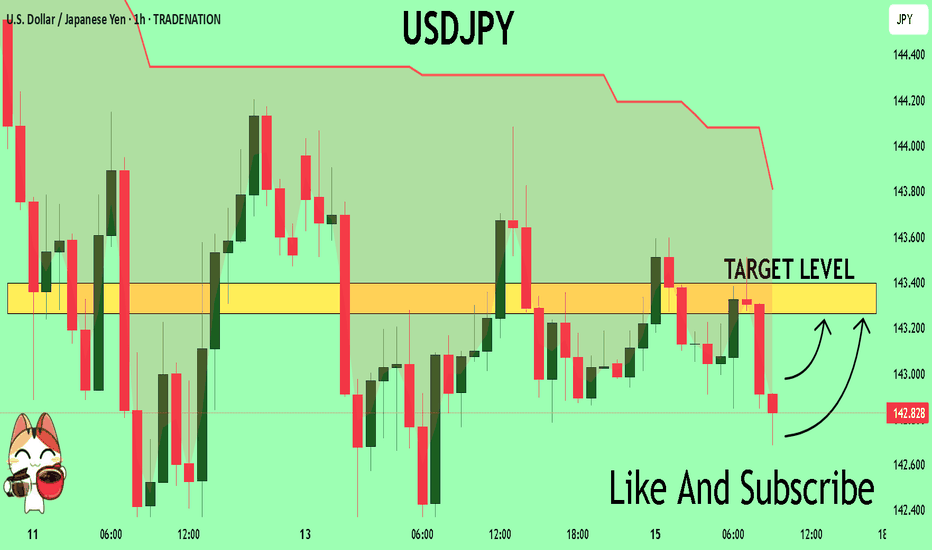
USDJPY, 60
Short-Term
15 April 2025
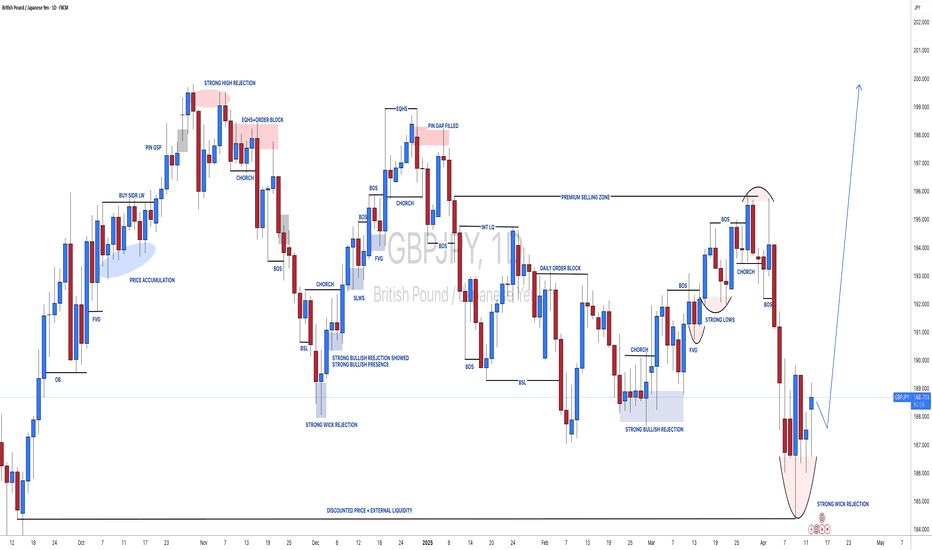
GBPJPY, 1D
Long-Term
14 April 2025
XAUUSD, 15
Short-Term
14 April 2025
XAUUSD, 360
Long-Term
14 April 2025
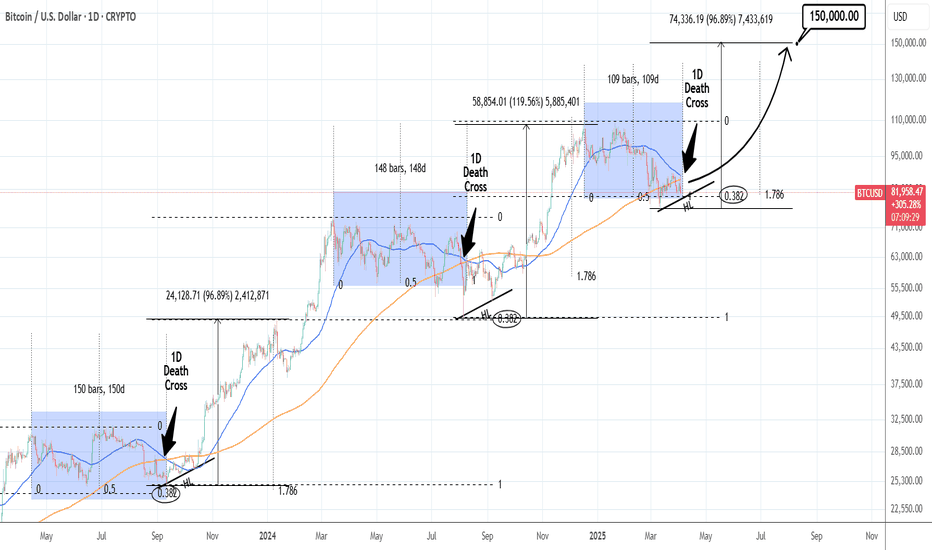
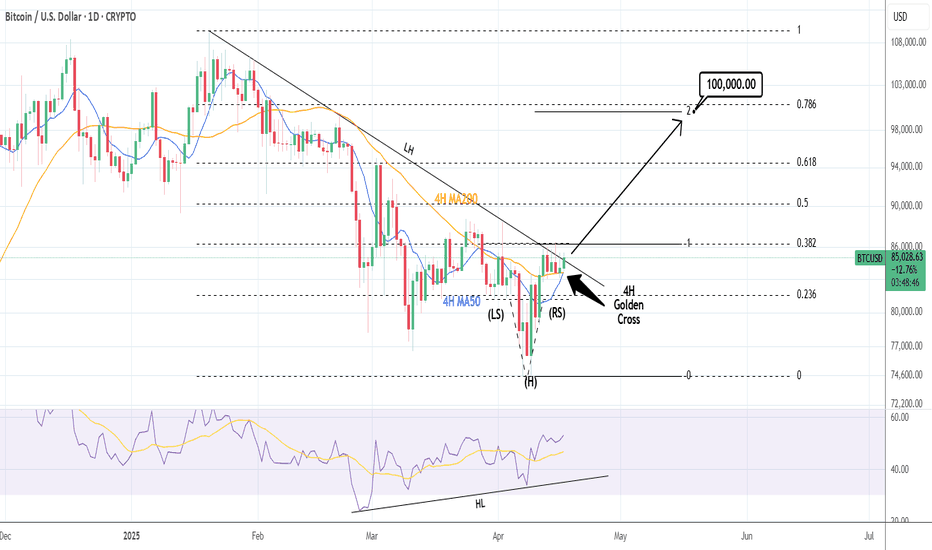
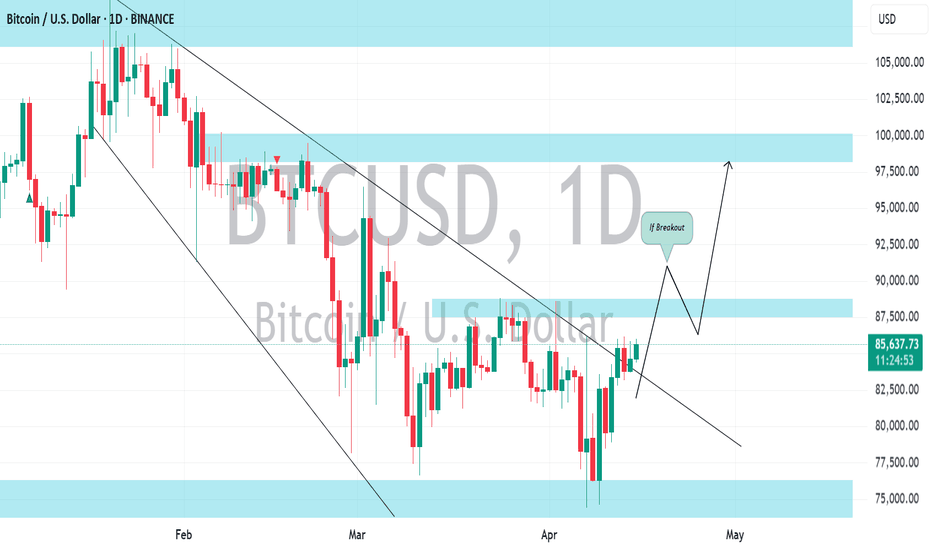
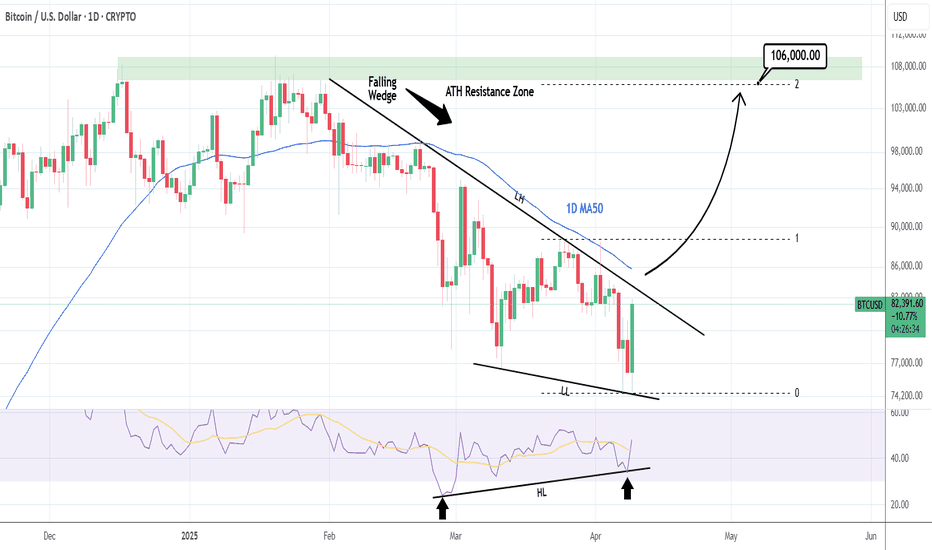
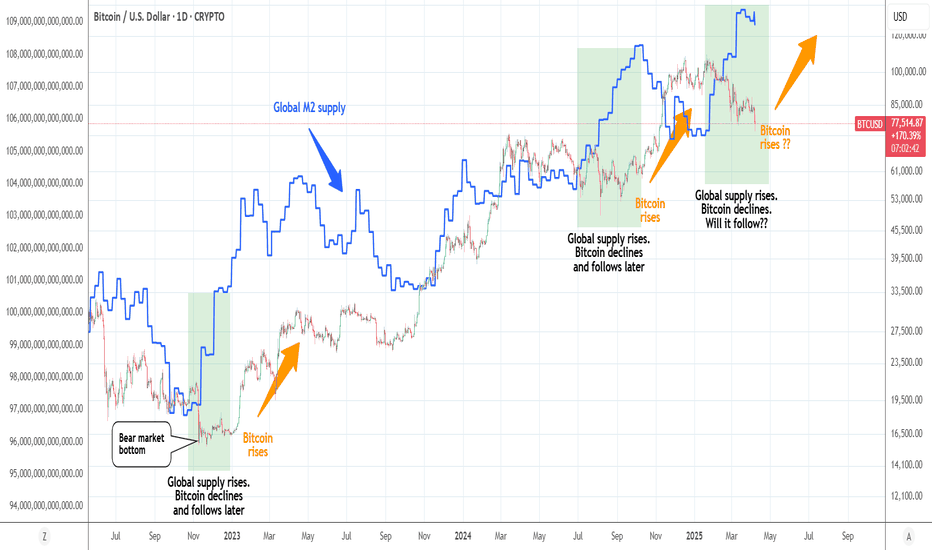
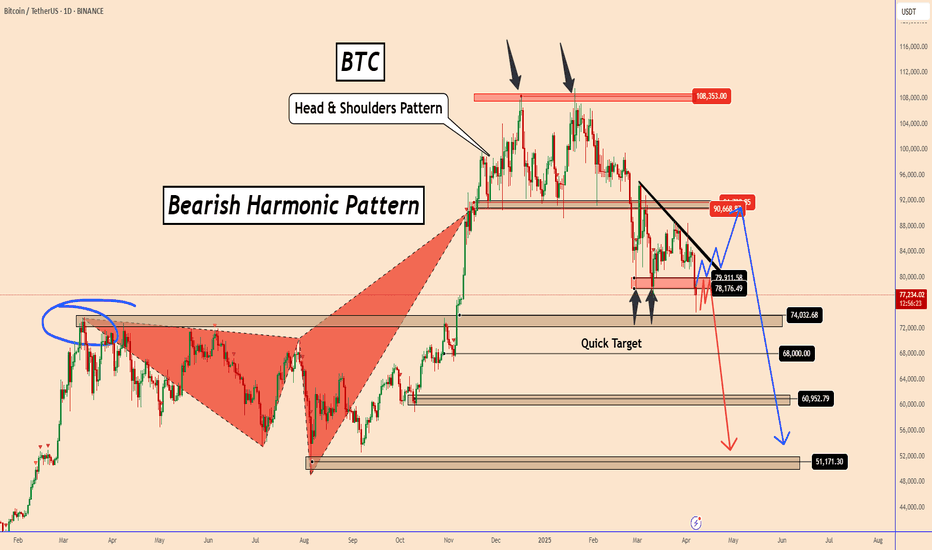
BTCUSD, 1D
Long-Term
17 April 2025
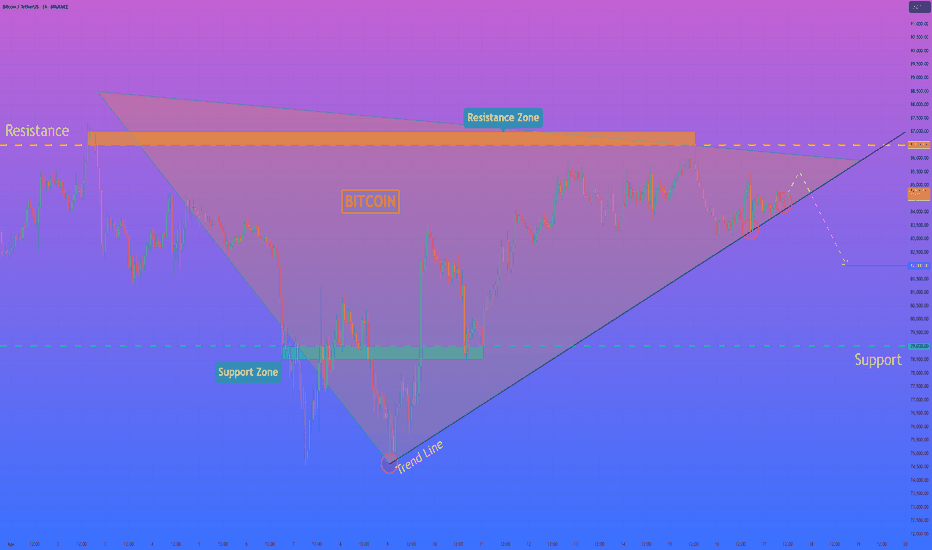
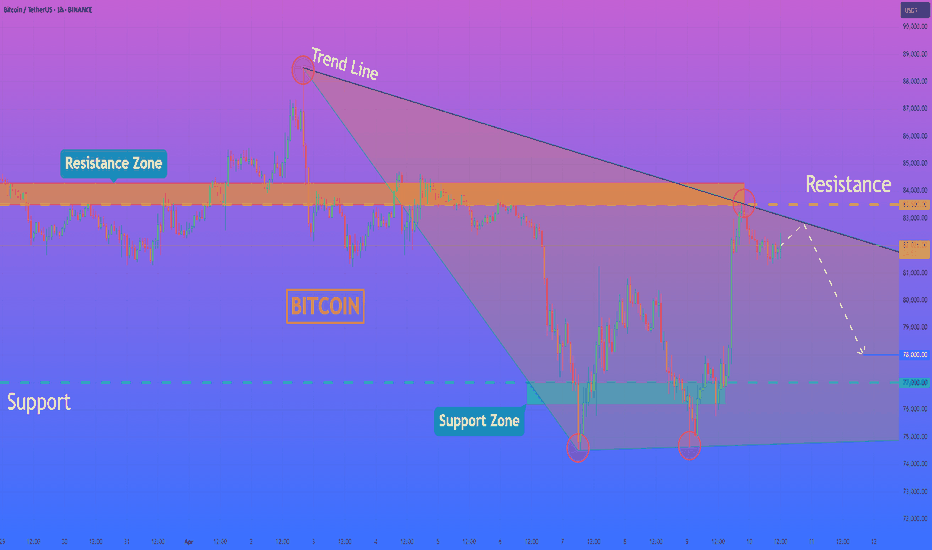
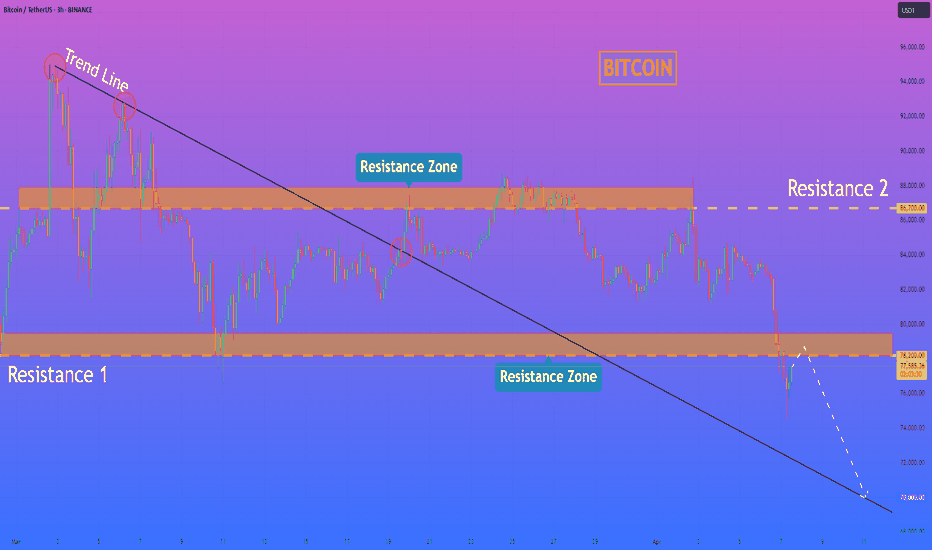
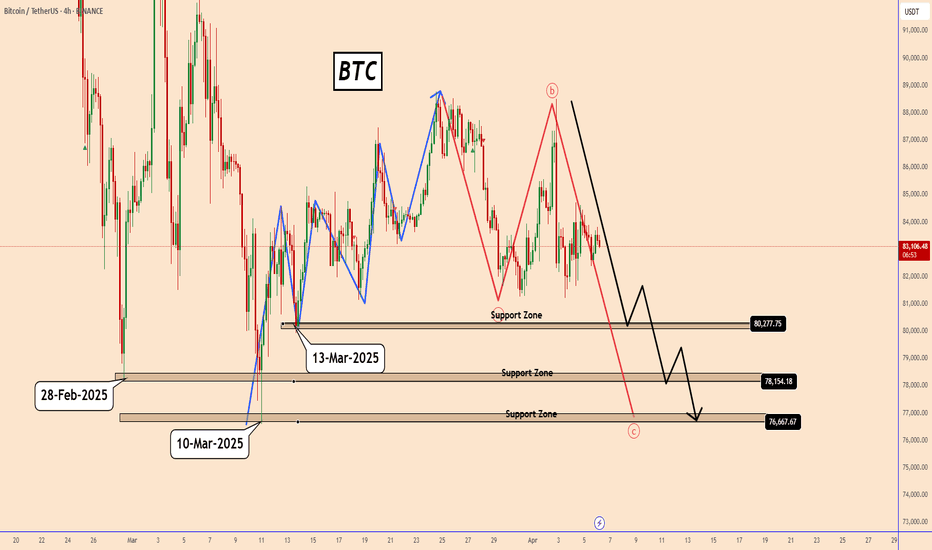
BTCUSDT, 60
Short-Term
17 April 2025
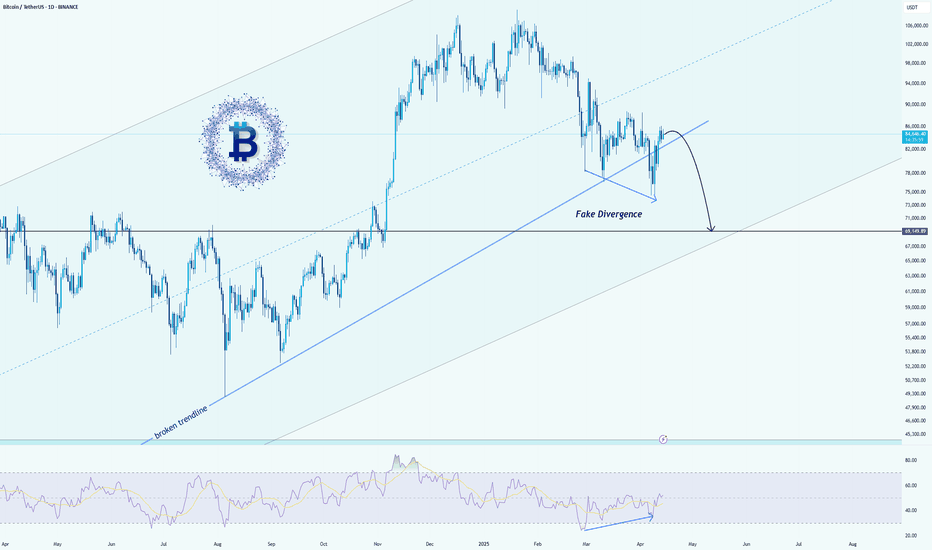
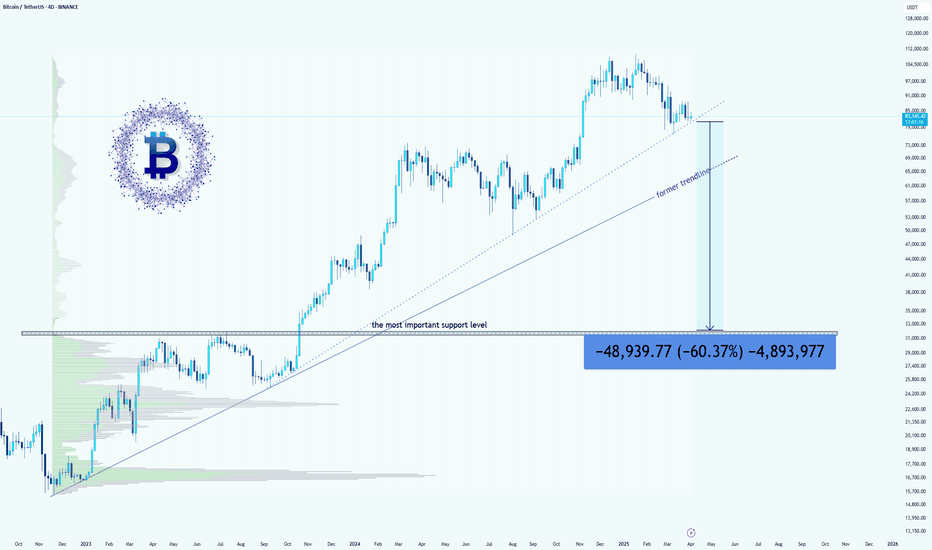
BTCUSD, 1D
Long-Term
15 April 2025
BTCUSDT, 1D
Long-Term
14 April 2025

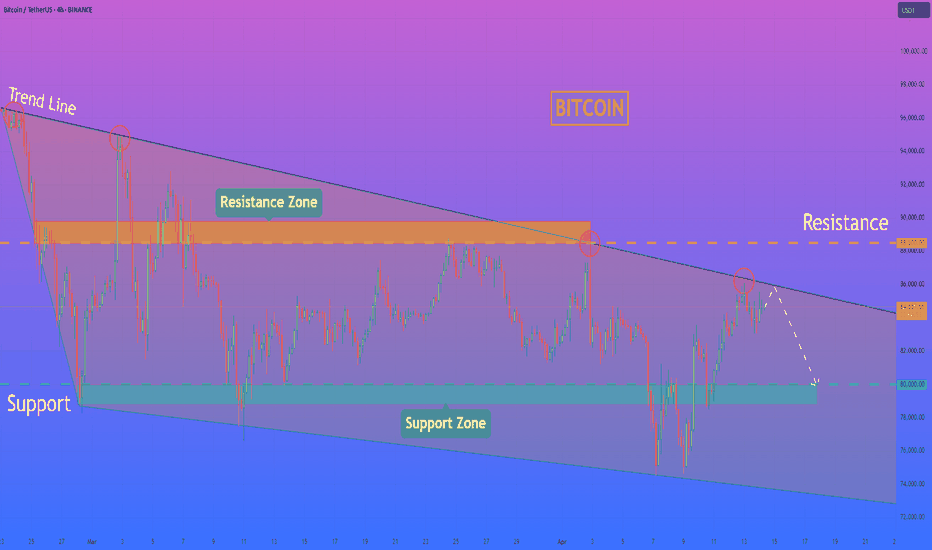
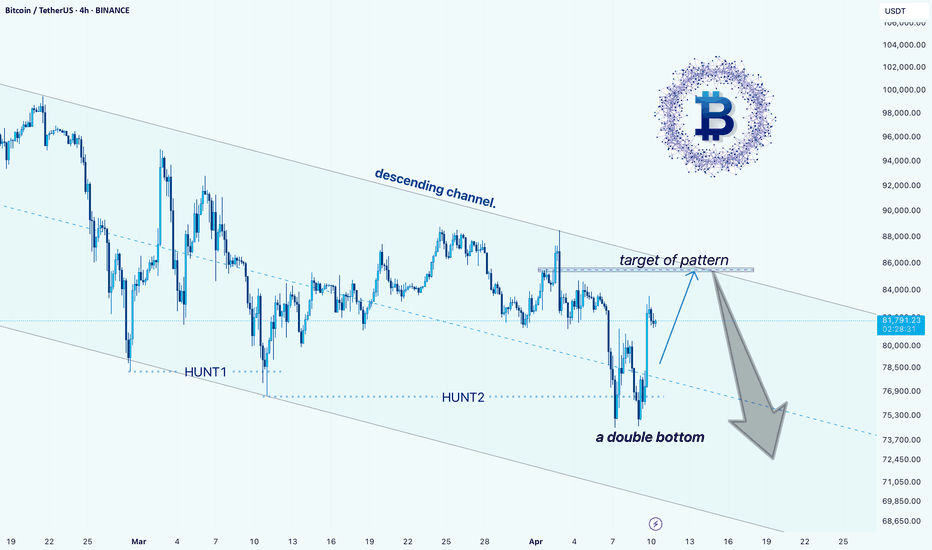
BTCUSDT, 240
Long-Term
14 April 2025
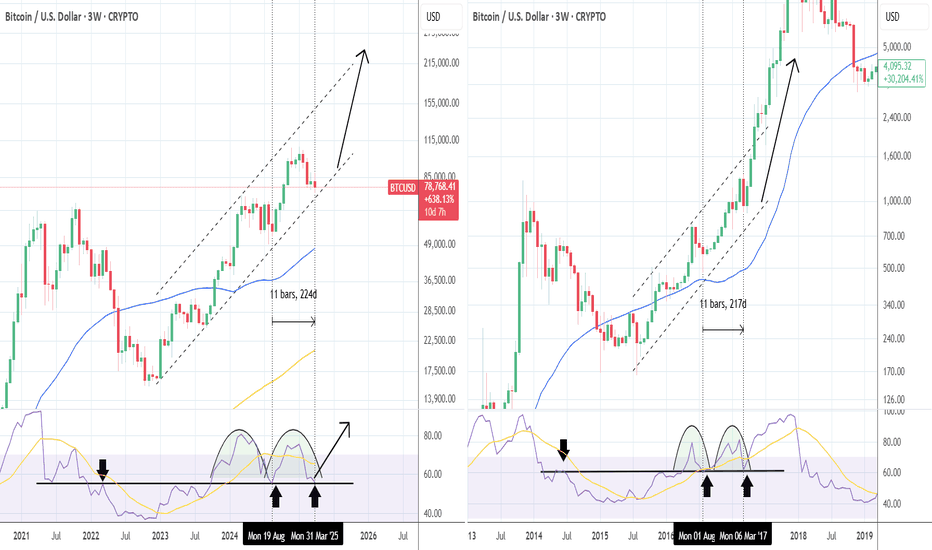
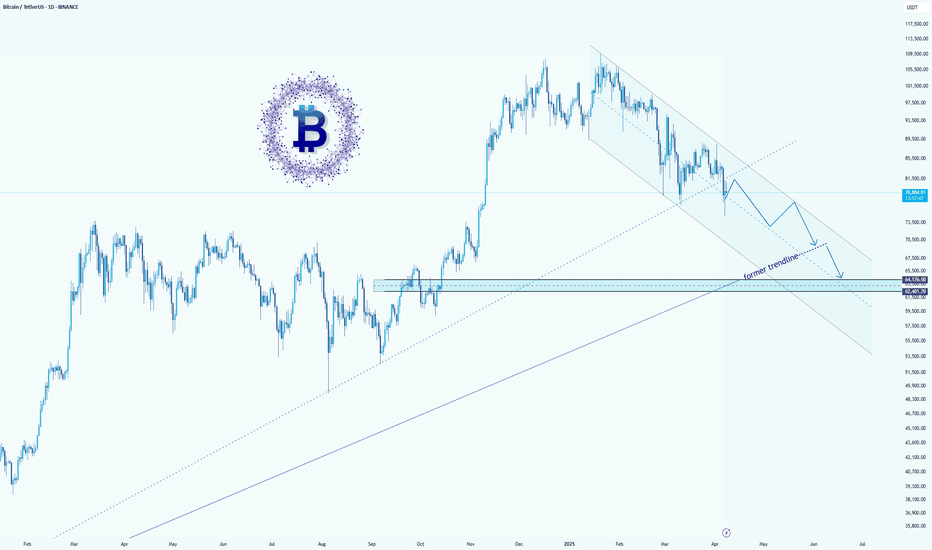
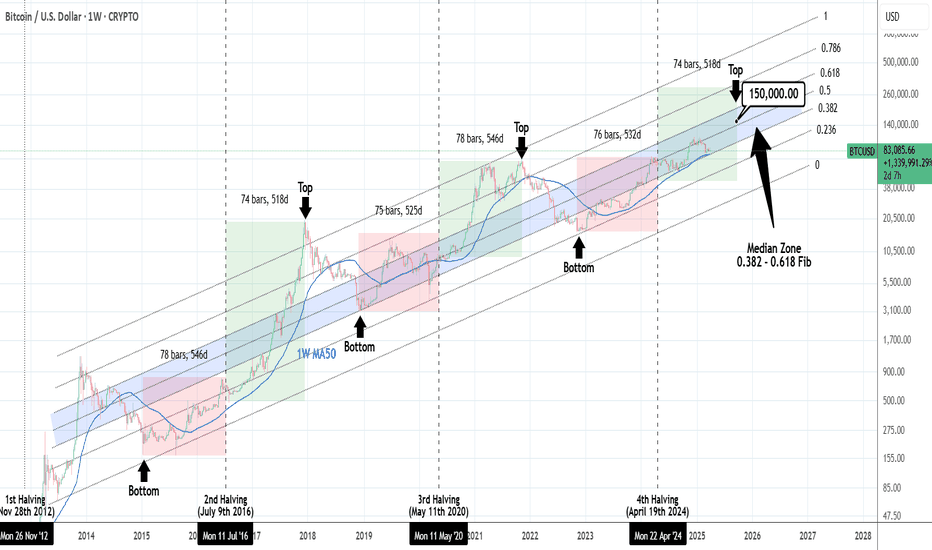
BTCUSD, 3W
Long-Term
10 April 2025
BTCUSDT, 60
Short-Term
10 April 2025
BTCUSDT, 240
Long-Term
10 April 2025
BTCUSD, 1D
Long-Term
09 April 2025
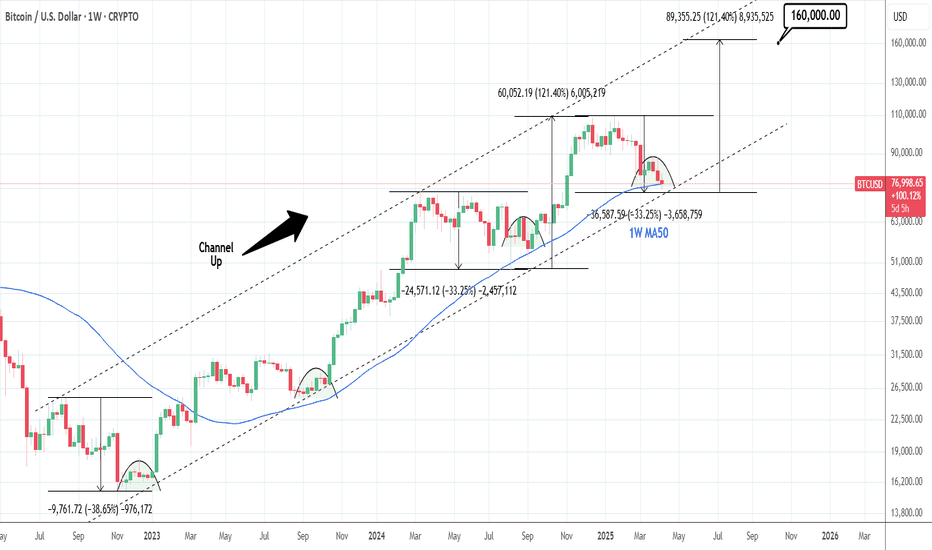
BTCUSD, 1W
Long-Term
08 April 2025
BTCUSDT, 1D
Long-Term
08 April 2025
BTCUSD, 1D
Long-Term
07 April 2025
BTCUSDT, 180
Medium-Term
07 April 2025
BTCUSDT, 1D
Long-Term
07 April 2025

BTCUSDT, 240
Long-Term
06 April 2025
BTCUSDT, 4D
Long-Term
06 April 2025
BTCUSD, 1W
Long-Term
04 April 2025
BTCUSD, 1D
Long-Term
03 April 2025