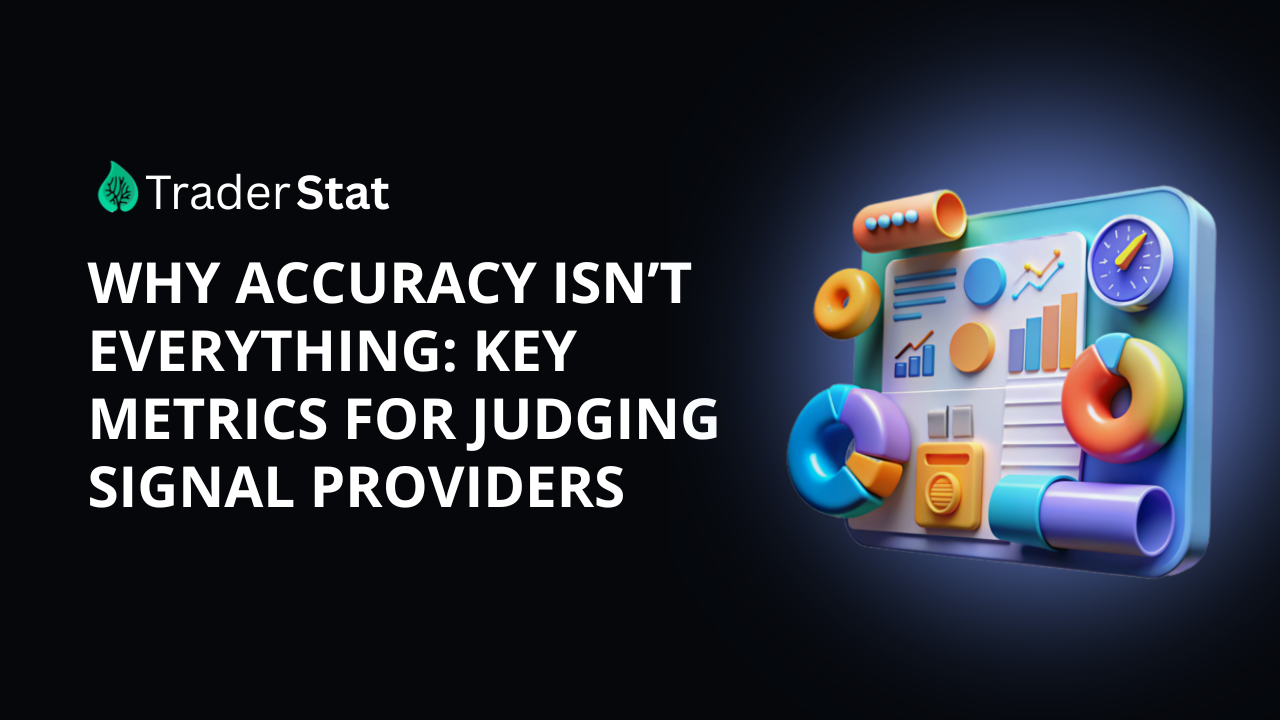
Why Accuracy Isn’t Everything: Key Metrics for Judging Signal Providers
🧠 Introduction
When evaluating trading signal providers, many traders make the mistake of focusing on one seductive number: accuracy. A provider claiming 90% win rates instantly draws attention—but is that number telling the full story? In truth, accuracy is only one piece of a much larger puzzle. Relying on it alone can mislead traders into following strategies that are unsustainable, overly risky, or simply not aligned with their goals.
In this article, we’ll explore the limitations of accuracy as a performance metric and introduce the essential indicators that every trader should consider when judging signal providers. Whether you’re new to copy trading or a seasoned investor seeking better insights, understanding these metrics will help you avoid costly mistakes and make smarter, more informed decisions.
🎯 The Allure—and Illusion—of Accuracy
Accuracy, or win rate, refers to the percentage of trades that end in profit. At first glance, it seems like the ultimate measure of success. After all, who wouldn’t want to follow a trader with a 95% success rate?
But here’s the catch: accuracy says nothing about how much was gained or lost on each trade. A provider could be winning 9 out of 10 trades, but if each win nets $10 and the lone loss costs $100, the strategy is unprofitable despite high accuracy.
📉 Example: The 90% Trap
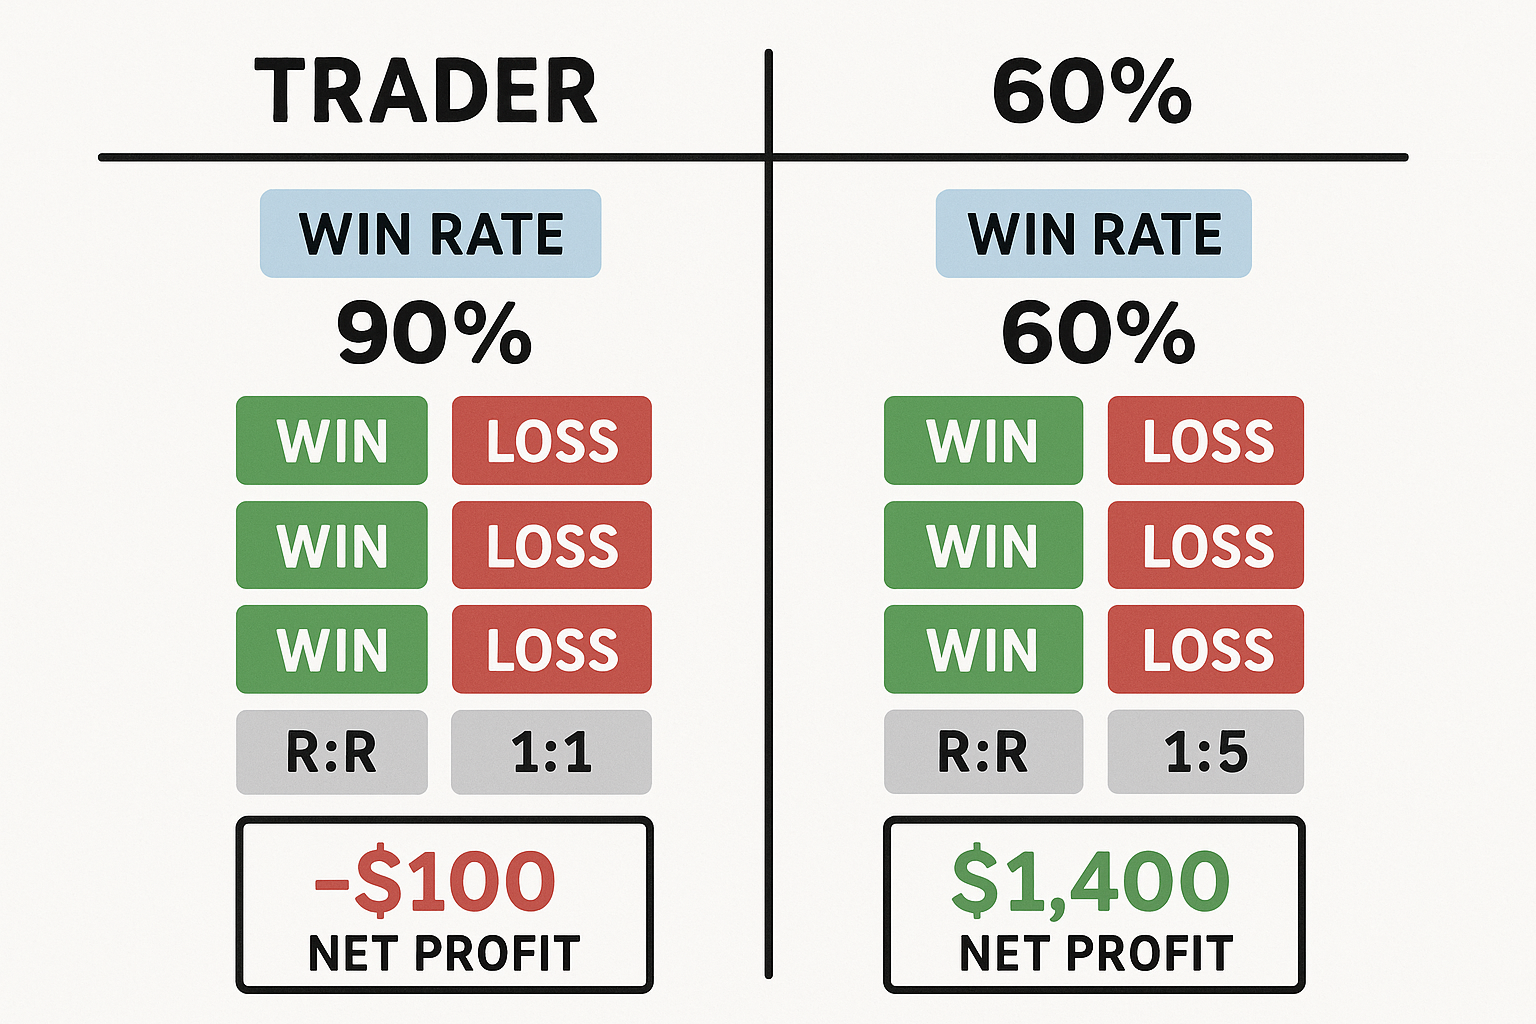
Consider this hypothetical scenario:
-
Provider A: 90% accuracy, average win = $10, average loss = $100
-
Provider B: 60% accuracy, average win = $200, average loss = $50
While Provider A looks safer, their risk-reward profile is deeply flawed. Over 10 trades:
-
Provider A: 9 x $10 = $90 in profit, 1 x -$100 = -$10 total
-
Provider B: 6 x $200 = $1,200, 4 x -$50 = -$200 = $1,000 total
This example highlights the danger of relying solely on win rate. To understand a signal provider’s true performance, we must go deeper.
⚖️ Key Metrics Beyond Accuracy
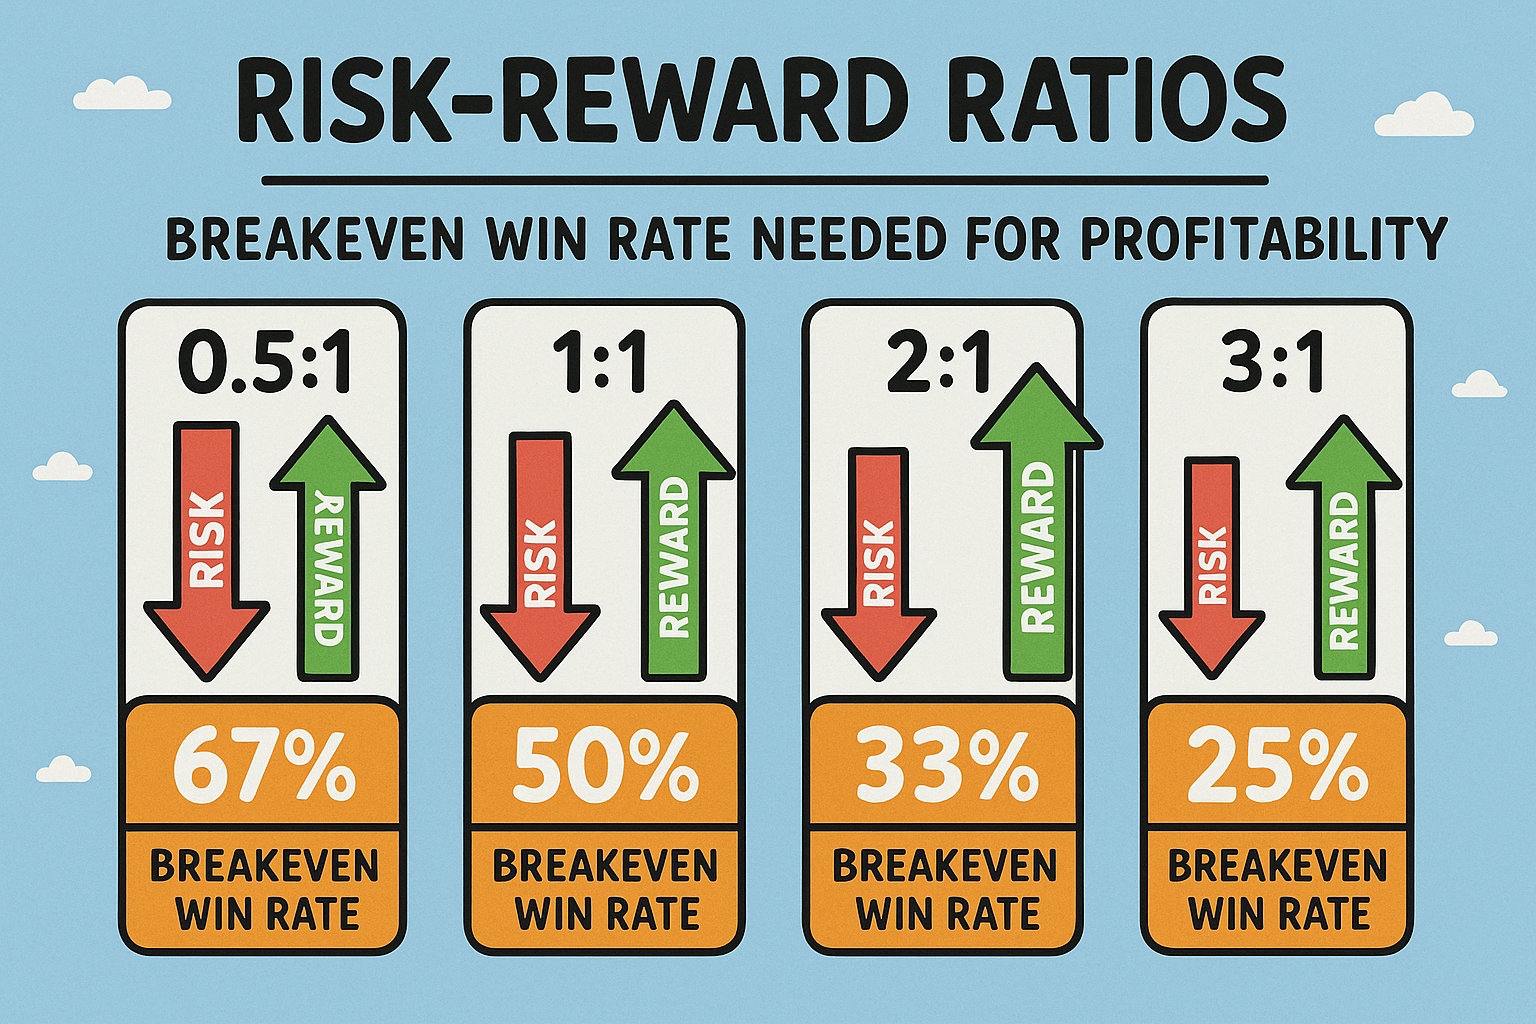
1. Risk-Reward Ratio (RRR)
Definition: The ratio of average profit on winning trades to average loss on losing trades.
Why It Matters: A high risk-reward ratio allows traders to be profitable even with lower win rates. It measures the quality of trade setups, not just their outcomes.
Ideal Range: 1.5:1 or higher is generally preferred, meaning your average win is at least 1.5 times your average loss.
Real-World Tip: A provider with a 40% win rate and 2.5:1 RRR may be more profitable and sustainable than one with an 80% win rate but a 0.5:1 RRR.
2. Consistency of Win Rate
Definition: How stable the win rate remains over time (weekly, monthly, quarterly).
Why It Matters: A signal provider with consistent performance is more reliable than one with extreme ups and downs. Volatile win rates may indicate luck, not skill.
How to Spot It: Look at the monthly breakdown of results. If win rate swings wildly—90% one month, 30% the next—it may reflect overfitting or inconsistent strategy execution.
Case Study: A trader using scalping in a low-volatility market might show great results temporarily, but if market conditions shift, performance can collapse. A consistent provider adjusts and maintains steady results.
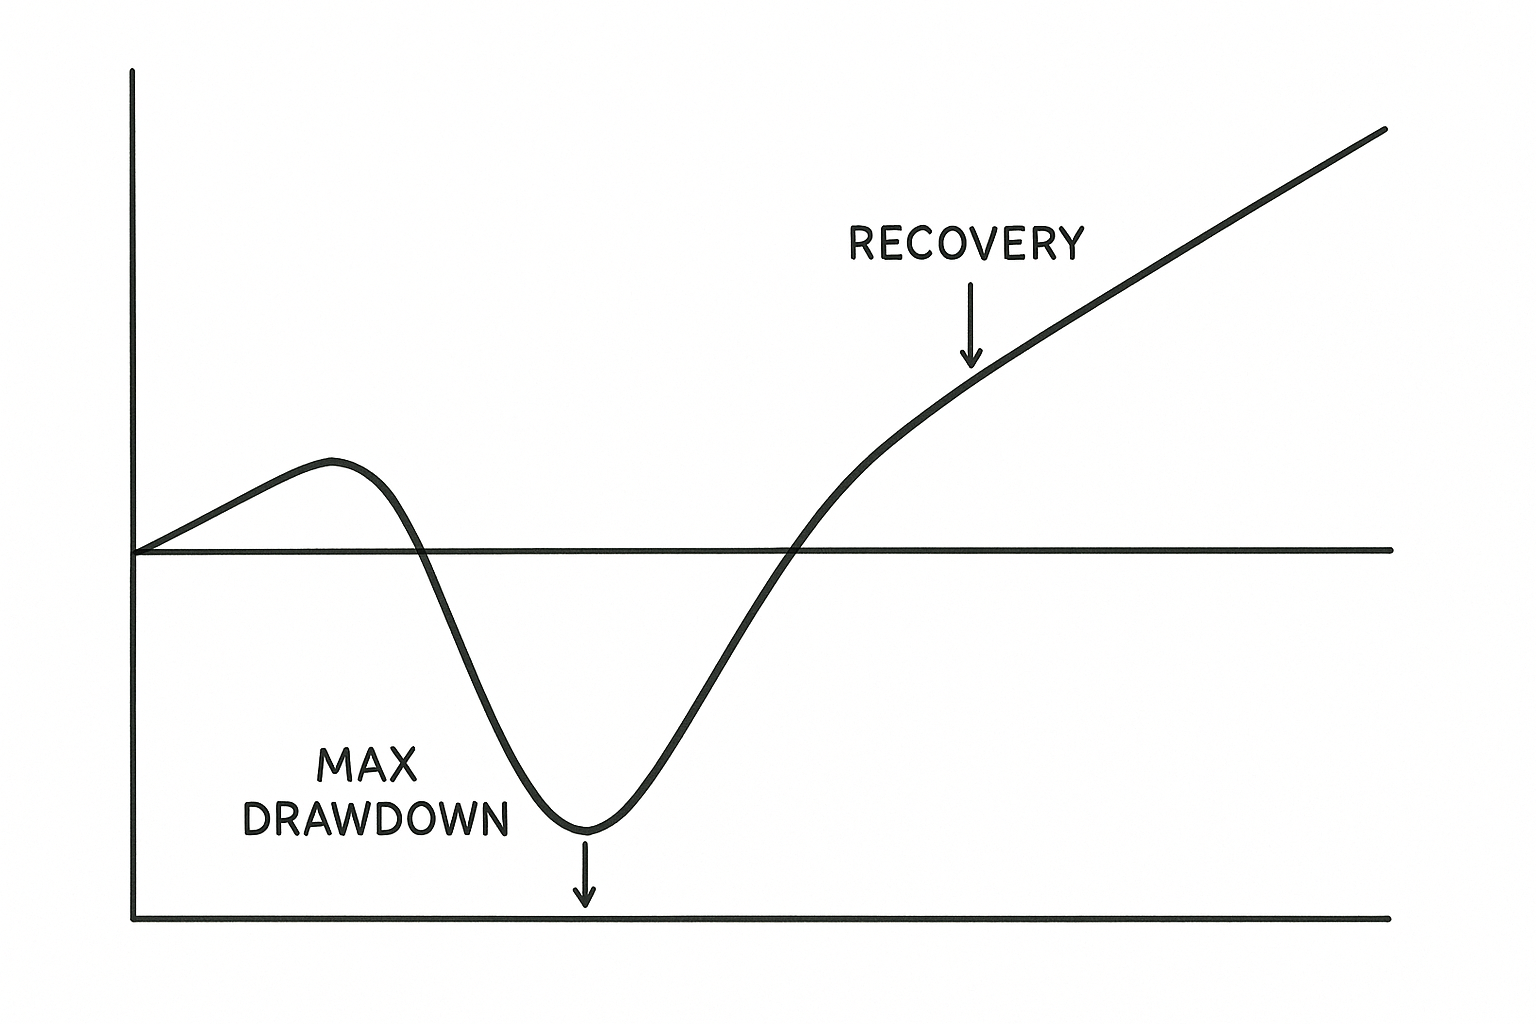
3. Maximum Drawdown
Definition: The largest peak-to-trough drop in equity during a trading period.
Why It Matters: Drawdown measures risk exposure and capital loss potential. A 40% drawdown means a trader lost nearly half their capital before recovering—hardly safe.
Investor Psychology: High drawdowns test emotional endurance. Even if a strategy eventually recovers, most traders abandon it mid-way due to fear or doubt.
Safe Range: Under 20% is ideal for most portfolios. Anything above 30% should trigger a closer look at strategy risk.
4. Trade Frequency
Definition: How often the provider generates signals (daily, weekly, monthly).
Why It Matters: Frequency affects how well you can follow signals and manage capital. Too few signals and growth is slow; too many and slippage, fees, or overtrading can eat into profits.
Consider Your Lifestyle: If you can’t monitor the market hourly, a high-frequency signal provider may not be suitable—even if results are good on paper.
Red Flag: Some providers inflate statistics by publishing dozens of micro trades, obscuring actual performance with noise.
5. Transparency and Verifiability
Definition: How openly and honestly a provider shares trading results, strategy context, and performance metrics.
Why It Matters: Trust is the foundation of signal-based trading. Without transparency, you’re blindly following someone else’s risk decisions.
Best Practices: Look for:
-
Verified performance history (not screenshots)
-
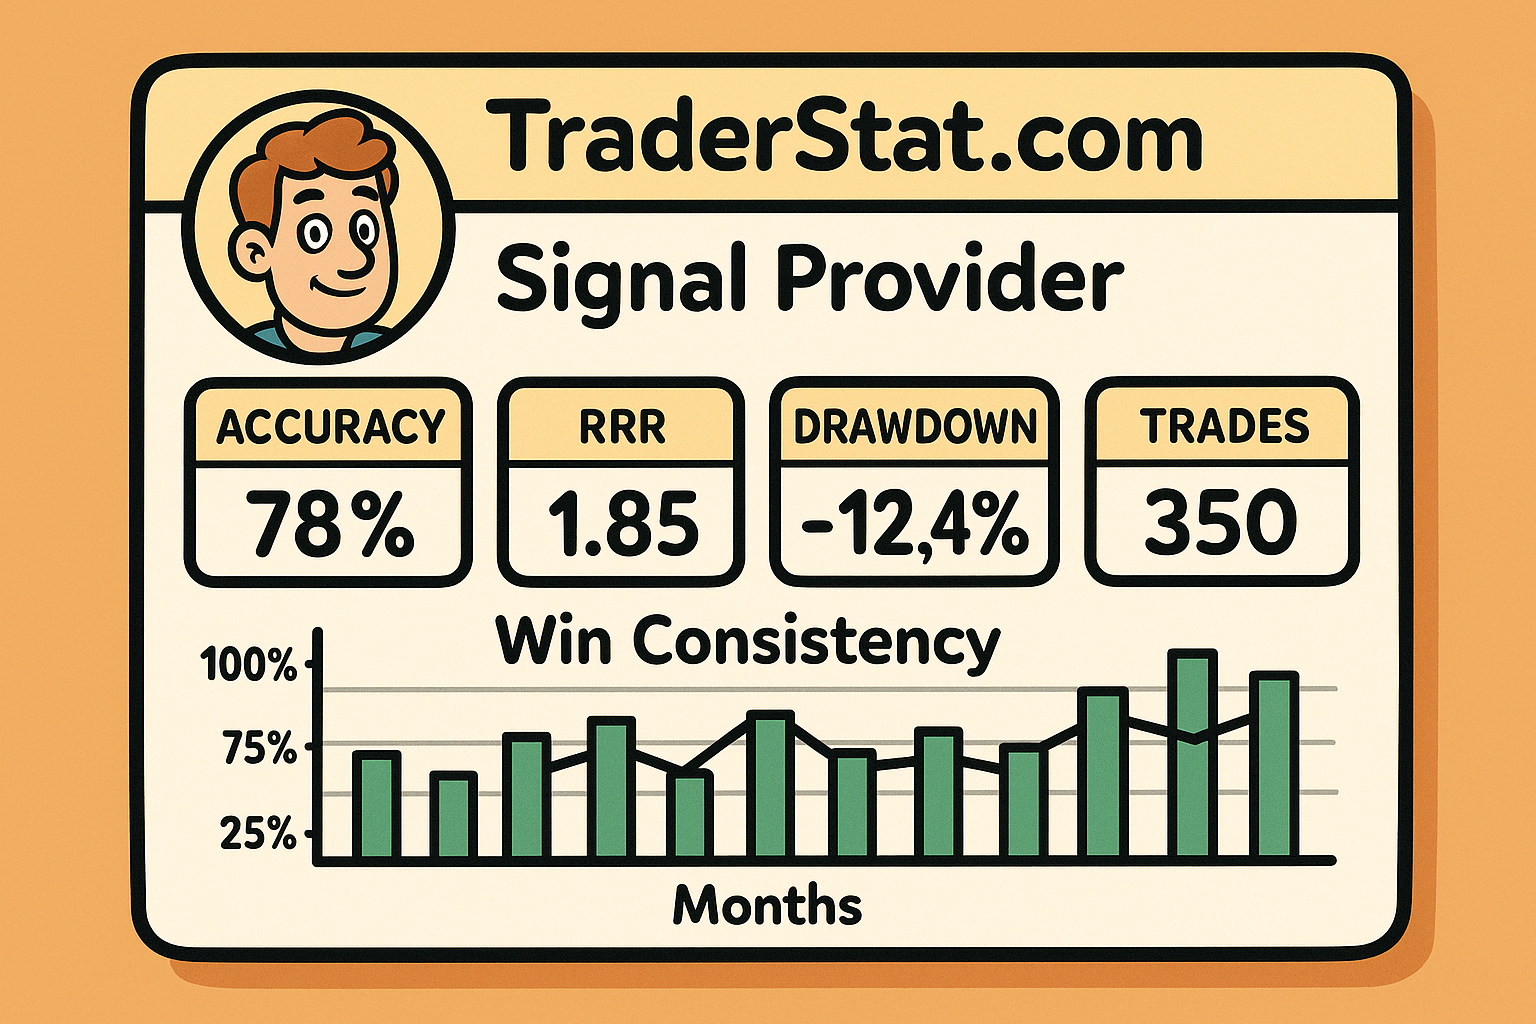
Third-party analytics (e.g., myfxbook, TraderStat.com)
-
Clear trade logs with timestamps, entry/exit points, and rationale
Cautionary Tale: Many social media “gurus” cherry-pick winning trades for promotion while hiding losing streaks. Without transparency, you may be following a mirage.
🧪 Putting It All Together: A Balanced Framework
Let’s compare two hypothetical providers using a full set of metrics:
| Metric | Provider Alpha | Provider Beta |
|---|---|---|
| Accuracy | 85% | 58% |
| Risk-Reward Ratio | 0.6:1 | 2.2:1 |
| Max Drawdown | 35% | 12% |
| Monthly Consistency | Volatile | Stable |
| Transparency | Private group only | Public trade log |
Conclusion: Although Alpha looks stronger due to high accuracy, Beta offers a much safer, more profitable, and verifiable path. Traders who only focus on accuracy may miss these nuances—and pay the price.
🌐 The Role of TraderStat.com in Smart Signal Evaluation
At TraderStat.com, we believe that informed traders make better decisions—not just based on flashy win rates, but on real, transparent data.
Our platform provides comprehensive analytics for hundreds of signal providers, including:
-
Verified trade histories
-
Risk-reward breakdowns
-
Win rate trends and consistency graphs
-
Max drawdown tracking
-
Provider rankings by profitability, risk, and performance over time
We also use AI-powered algorithms to flag potential red flags and help you avoid misleading metrics. With detailed filtering tools, you can search for providers by asset class, trading frequency, risk profile, and more—saving time and reducing risk.
✅ Summary: What to Look for Instead of Just Accuracy
Accuracy is only the surface. To judge signal providers wisely, you need to understand the deeper metrics that drive real trading outcomes.
🧩 Key Takeaways:
-
Risk-reward ratio shows whether your wins are worth your losses.
-
Win rate consistency ensures the provider’s edge is stable.
-
Drawdown reveals how much pain your account may endure.
-
Trade frequency should match your availability and strategy.
-
Transparency builds trust and reduces the chance of manipulation.
Choosing a signal provider without considering these factors is like investing in a company based solely on revenue without checking costs, debts, or leadership.