TraderStat
Solana logo

SOL

Solana

Solana #7

$75.68

Score 72/100

-0.93%
Loading TradingView chart…

Interactive TradingView Lightweight Chart with TraderStat AI lines, patterns, support, and resistance from the latest Supabase analysis.

Daily market update · August 21, 2026 · TraderStat data snapshot

Solana Market Analysis Report

Full daily overview from technical analysis, chart geometry, DEX and onchain trader positioning, social signals, and market metrics.

Summary
  • Solana (SOL) has an overall Buy signal at 72/100.
  • DEX traders positioning is not available in the latest snapshot.
  • Social traders: 0 buy / 0 sell across verified and tracked setups.
Long-term analysis
Reasons supporting a buy
  • Technical metrics are 69/100.
Reasons supporting a sell
  • Chart patterns are 0/100.
Short-term analysis

Short-term context gives more weight to DEX positioning, social ideas, and chart patterns. Solana currently reads as Buy.

DEX traders

SOL DEX wallets positioning is not available in the latest snapshot. All tracked crypto DEX wallets positioning is not available in the latest snapshot.

No open DEX positions for this asset are in the latest Hyperliquid snapshot.

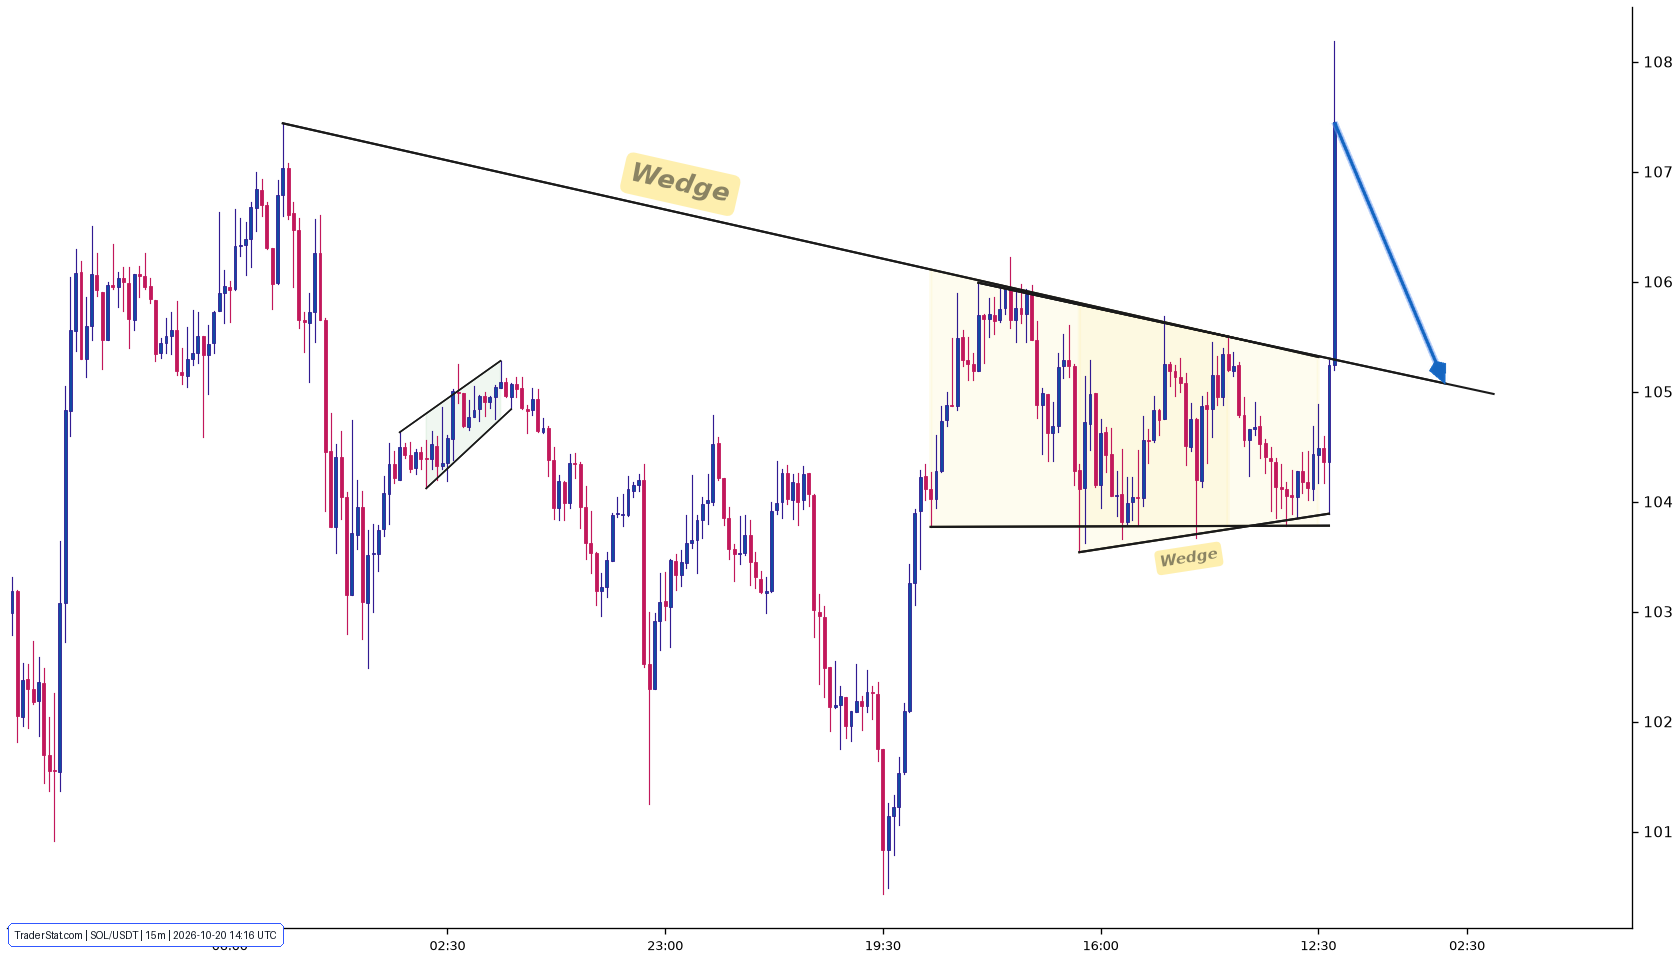
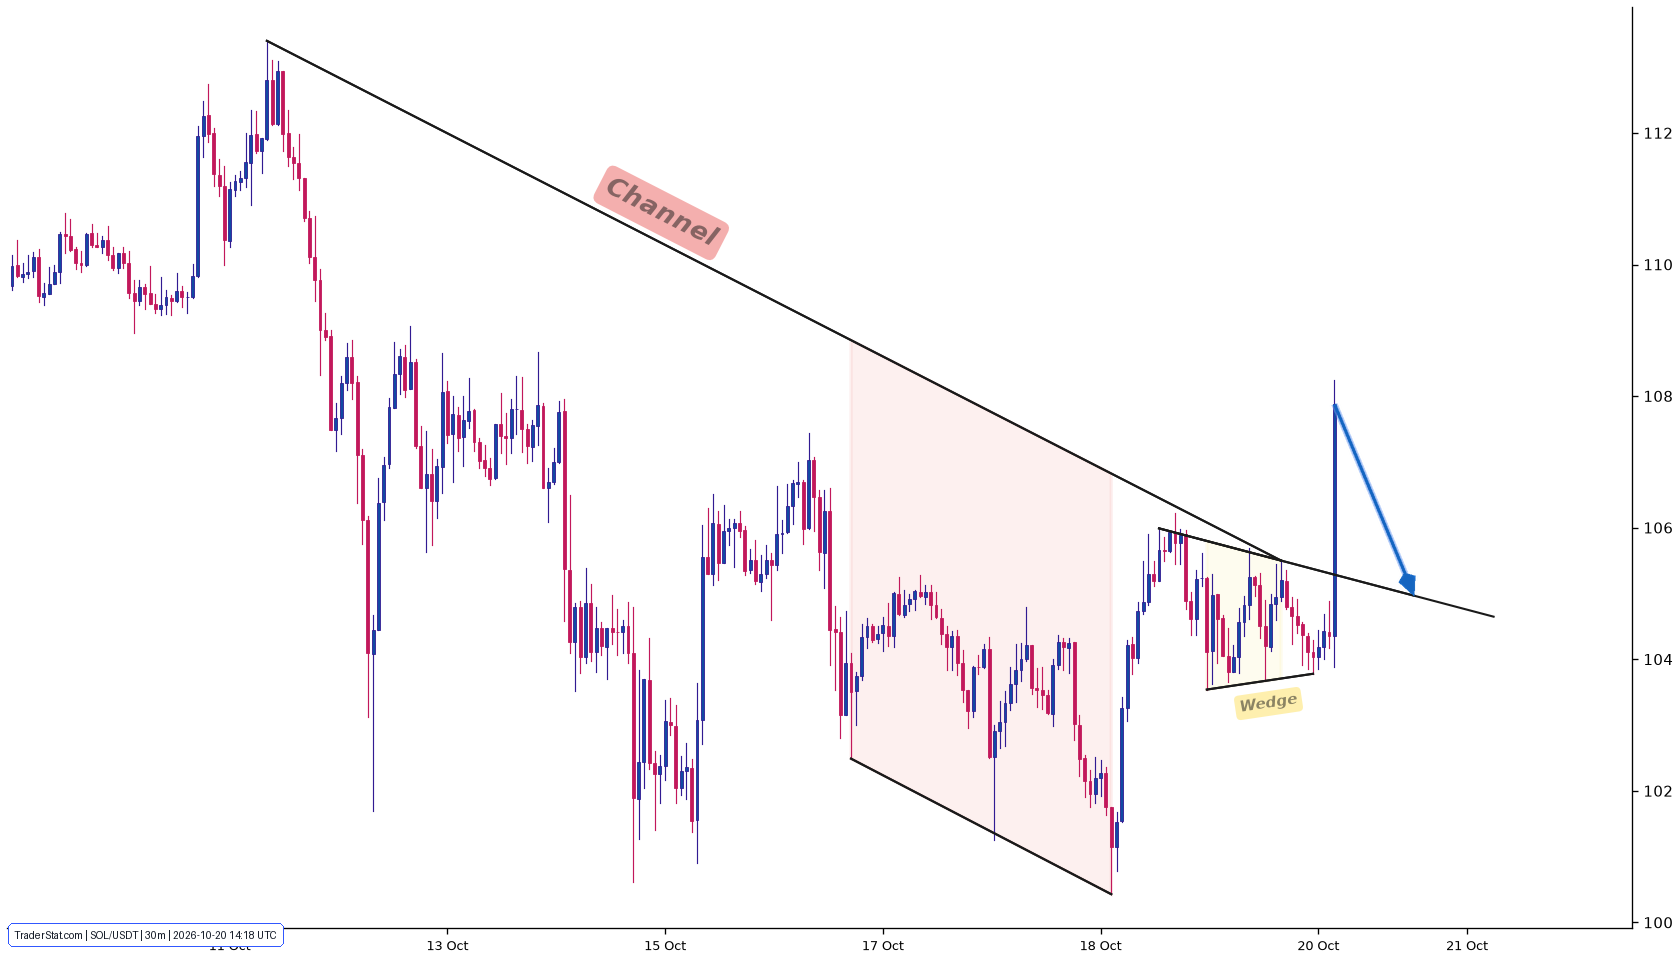
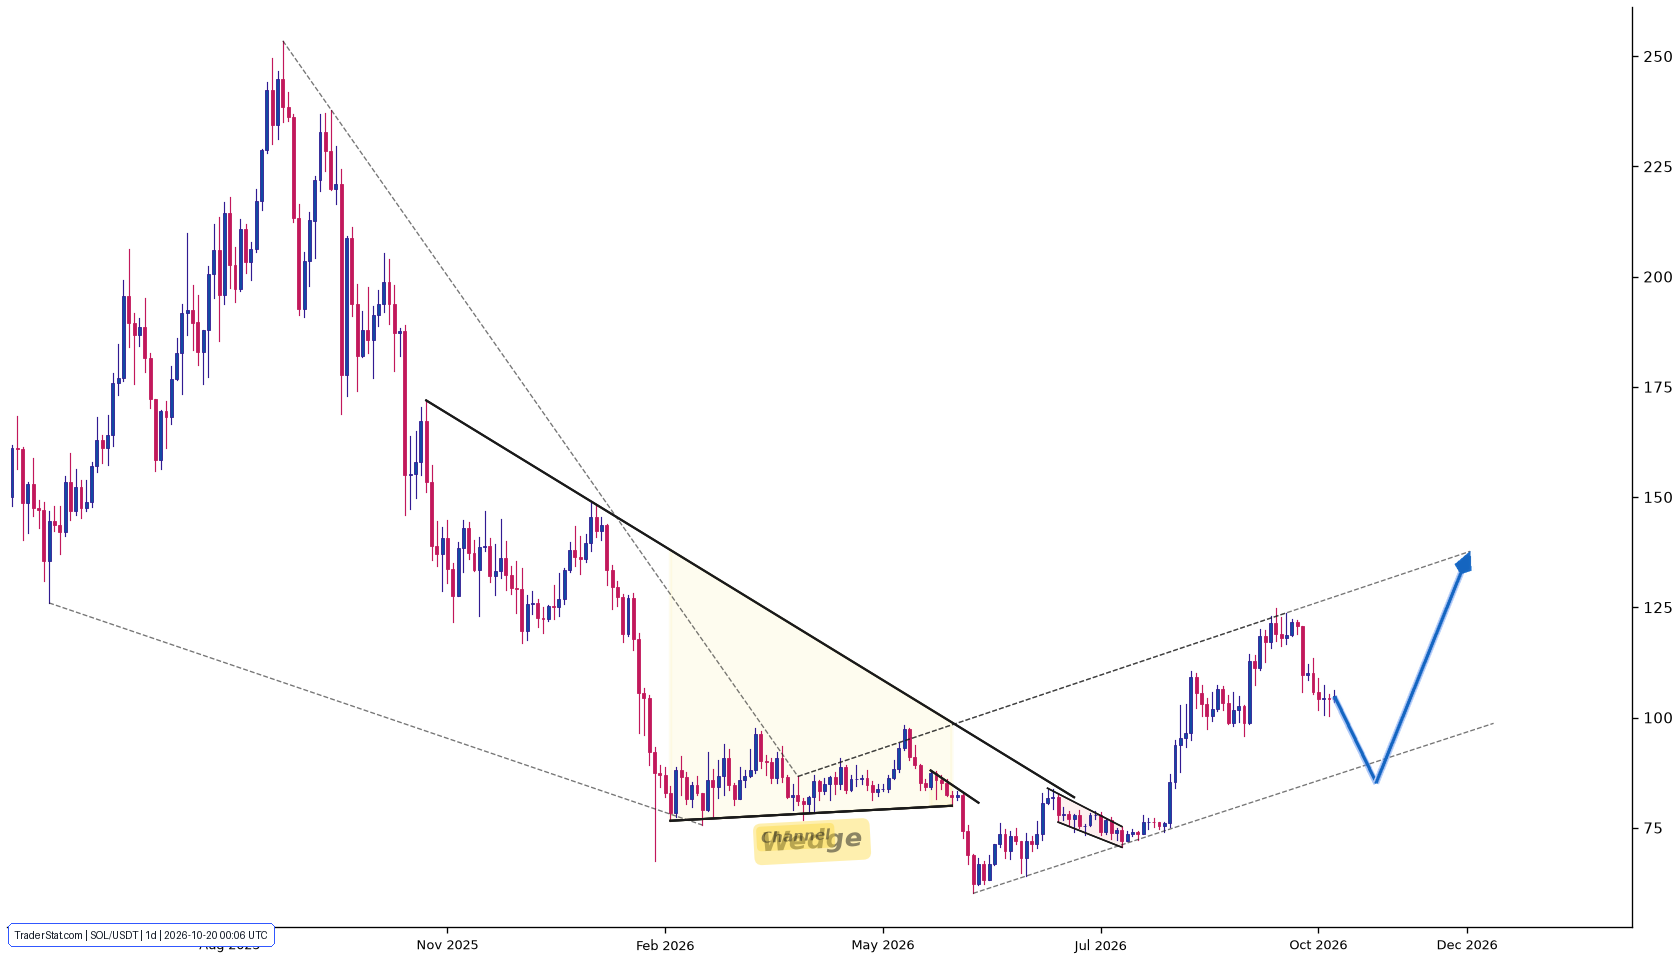
Chart patterns

Chart pattern score is 0/100 (Strong Sell).

Signal-by-signal analysis
Technical metrics

Technical metrics are 69/100 and Buy.

On-chain activity

On-chain market metrics are 50/100.

DEX traders

SOL open positions positioning is not available in the latest snapshot.

Social traders

Verified social positioning is not available from 0 directional ideas (0 buy / 0 sell).

No live setups from top 10% traders or tracked leader trades yet.

Fundamental context

Fundamental rating is 84/100. Missing layers are excluded rather than treated as a neutral 50.

Conclusion

Solana analysis is a live data snapshot rather than a personalized recommendation. DEX traders, social traders, and chart patterns are read together; a stronger directional conclusion requires agreement between these available inputs.

Overall Score
72/100
x
Buy

Combined signal across available data layers.

Timeframe map
Read the signal from D1 to M30
D1 answers whether the environment supports the idea. H1 defines the active setup. M30 is only for execution and should not overturn the daily context.
Evidence, not decoration
Why the rating is 72/100
“Rating pressure” is an estimated direction versus a neutral score of 50. It is deliberately not shown as an exact model weight.

Statistics

24h price change

-0.93%

Analysis coverage

6 timeframes

Data layers

6 independent scores